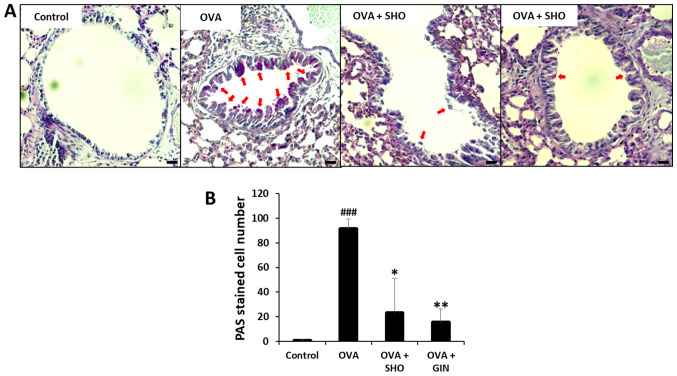
Figure 4.
Effects of SHO and GIN on mucus production in lung tissues. The right lung lobes were isolated 24 h after the final OVA challenge. Then, 4 µm-cut-lung sections were stained with PAS to analyze mucus production. (A) Panels show PAS-stained lung sections obtained from the control (first), OVA (second), OVA + SHO (third) and OVA + GIN (fourth) groups. Magnification, x200; scale bars, 75 µm. Fixed lung tissues were stained with PAS for visualizing mucus production. (B) PAS-stained cells are goblet cells presented with a red arrow. Values are presented as mean ± SD (n=6). ###P<0.001 vs. control group; *P<0.05, **P<0.01 vs. OVA group. OVA, ovalbumin; SHO, 6-shogaol; GIN, 6-gingerol; PAS, periodic acid-Schiff.

