

Abstract
Objective
To estimate the impact of the $600 per week Federal Pandemic Unemployment Compensation (FPUC) payments on health care services spending during the Covid pandemic and to investigate if this impact varied by state Medicaid expansion status.
Data Sources
This study leverages novel, publicly available data from Opportunity Insights capturing consumer credit and debit card spending on health care services for January 18–August 15, 2020 as well as information on unemployment insurance claims, Covid cases, and state policy changes.
Study Design
Using triple‐differences estimation, we leverage two sources of variation—within‐state change in the unemployment insurance claims rate and the introduction of FPUC payments—to estimate the moderating effect of FPUC on health care spending losses as unemployment rises. Results are stratified by state Medicaid expansion status.
Extraction Methods
Not applicable.
Principal Findings
For each percentage point increase in the unemployment insurance claims rate, health care spending declined by 1.0% (<0.05) in Medicaid expansion states and by 2.0% (<0.01) in nonexpansion states. However, FPUC partially mitigated this association, boosting spending by 0.8% (<0.001) and 1.3% (<0.05) in Medicaid expansion and nonexpansion states, respectively, for every percentage point increase in the unemployment insurance claims rate.
Conclusions
We find that FPUC bolstered health care spending during the Covid pandemic, but that both the negative consequences of unemployment and moderating effects of federal income supports were greatest in states that did not adopt Medicaid expansion. These results indicate that emergency federal spending helped to sustain health care spending during a period of rising unemployment. Yet, the effectiveness of this program also suggests possible unmet demand for health care services, particularly in states that did not adopt Medicaid expansion.
Keywords: access to health care, health expenditures, Medicaid, policy analysis, social policy
What is known on this topic
At the onset of the Covid pandemic more than one‐third of excess deaths were unrelated to Covid, while health care visits for checkups and vaccinations plummeted as did emergency department visits for serious conditions like heart attacks and strokes.
Real‐time survey data show that people avoided health care visits over the fear of exposure to Covid, but cost concerns were also paramount, particularly among the unemployed.
We examine whether federal spending on emergency unemployment benefits bolstered health care services spending during the early stages of the pandemic.
What this study adds
Health care services spending declined by 1% for each percentage point increase in the unemployment insurance claims rate in Medicaid expansion and by 2% in nonexpansion states.
The $600 per week in emergency federal unemployment benefits mitigated 0.8 points of this relationship in Medicaid expansion states and 1.3 points in nonexpansion states.
These results suggest federal income transfers bolstered health care service spending during the pandemic, particularly in states that did not expand Medicaid.
1. INTRODUCTION
In March 2020, the Covid pandemic brought the US economy to a sudden halt. With businesses shuttered, and schools and childcare closed, unemployment rose to levels not seen in decades. That same month, Congress passed the Coronavirus Aid, Relief, and Economic Security (CARES) Act, a nearly $2 trillion package with income support provisions, including an unprecedented expansion of unemployment insurance (UI). This study explores whether this temporary UI expansion supported health care services spending in the face of rising unemployment.
1.1. The decline in health care services usage
During the first 3 months of the pandemic, official death records indicate more than one‐third of excess deaths were unrelated to Covid. 1 Although non‐Covid fatalities may be misattributed, large increases in deaths from seemingly unrelated causes like heart disease, Alzheimer's, and cerebrovascular disease suggest the pandemic delayed access to necessary care. 1 , 2 Early in the pandemic, there were significant declines in emergency department visits for heart attacks and strokes, visits for routine cancer screenings, child vaccinations, and pediatric care. 3 , 4 , 5 , 6 , 7 , 8 Nearly one‐half of adults in a nationally representative sample from May 2020 reported that a household member skipped medical care because of the pandemic. 9 The slow recovery of childhood vaccinations is of particular concern. 10
In addition to fear of Covid exposure, concerns about cost appear to have been a major contributor to declining health care usage within the first 2 months of the pandemic. 9 , 11 , 12 , 13 For example, an estimated 7 million adults reported delaying treatment for Covid symptoms because of cost concerns. 11 Meanwhile over one‐fifth of adults in families experiencing unemployment or income loss reported an unmet need for medical care in the past month because of cost, twice the rate for stably employed adults. 13 Among the unemployed, the cost was particularly salient for low‐income families and people of color. The rate of recent unmet medical need because of cost was approximately 30% among Black and Hispanic adults and adults living in low‐income families experiencing unemployment. 12 Health care usage began to rebound in May 2020, 7 , 8 as federal income support programs rolled out, but more research is needed to understand what impact they had in supporting health care services spending.
1.2. Federal expansion of UI benefits
The CARES Act provided lump‐sum Economic Impact Payments (EIPs), and expanded UI benefits to cover previously ineligible groups, including self‐employed and gig‐economy workers, independent contractors, and workers with insufficient work histories, groups disproportionately impacted by job loss. 14 Congress also created the Federal Pandemic Unemployment Compensation (FPUC) program providing an additional $600 weekly supplement to state UI benefits from April to July 2020. State UI benefits combined with FPUC payments replaced 100% of lost wages for the average unemployed worker, with an even greater replacement rate for lower‐wage workers. 15 The magnitude of job losses and expansion of UI led an unprecedented number of workers to file for benefits, with nearly 32 million UI claims in the first week of July 2020. In May 2020, the states and the federal government spent $94 billion on UI, far above recent annual expenditures on the Supplemental Nutrition Assistance Program. 16 , 17
Economists estimate the pandemic resulted in earnings losses of $250 billion over its first 5 months, with low‐wage workers suffering the most. 18 However, studies show that CARES Act income support measures lifted total income above prepandemic levels for low‐income households during the early stages of the pandemic. 18 , 19 Consumer spending rebounded most quickly for low‐income households with the onset of CARES Act provisions, 19 while evidence indicates the historic influx of income support temporarily buffered many families against poverty and hardship. 20 , 21 Nationally representative surveys find roughly one‐in‐ten households reported difficulty paying their rent or mortgage in the early months of the pandemic, 13 , 22 , 23 but rates did not materially worsen as the pandemic extended into July 2020. 20
Nationally representative surveys fielded in late March/early April and May 2020 suggest UI payments reduced health care‐related hardship. 24 Families receiving UI reported modest increases in unmet need for medical care between surveys (23.2%–25.6%), but unmet medical needs increased considerably among families that applied for UI but did not receive benefits (25.4%–34.2%). Similarly, the percentage who worried about paying medical bills declined 6.2 percentage points across surveys for UI recipients but was relatively unchanged for those who applied for but did not receive UI. If provider cancelations and patient fear of virus exposure were the only factors contributing to unmet medical need, there should be no difference between UI recipients and nonrecipient. Yet more research is needed to understand exactly what role CARES Act income provisions have played.
1.3. Loss of health insurance and Medicaid expansion
Loss of employer‐sponsored health insurance (ESI) during the pandemic may have compounded cost concerns, particularly among the unemployed. By mid‐2020, an estimated 3 million people had lost ESI while nearly 2 million became uninsured. 25 Coverage losses were less than initially feared as job losses were concentrated in industries with low prepandemic ESI rates, while many who lost insurance obtained coverage elsewhere, including Medicaid and Affordable Care Act (ACA) exchanges. 26 , 27 , 28
Important state policy differences may have affected coverage and out‐of‐pocket medical expenses. 26 , 29 , 30 Perhaps most important is whether states had expanded Medicaid eligibility under the Affordable Care Act (ACA). By the start of the pandemic, 35 states and the District of Columbia had done so, extending coverage to adults who earn too little to receive tax credits through the ACA exchanges but who did not previously qualify for Medicaid. 31 Between late March/early April and May, the percent of adults in expansion states affected by unemployment who enrolled in Medicaid increased (14.5%–16.5%) with only a small uptick in the percent uninsured (12.0%–12.7%). 29 Meanwhile, nonexpansion states saw a large increase in the percent covered by nongroup plans like ACA exchange policies (7.3%–14.3%) and the percent uninsured (21.1%–24.9%). This differential rise in uninsurance persisted through July 2020. 25 Access to and the comprehensiveness of available health insurance are important contextual factors for understanding how income transfers might impact health services spending. Thus, it is important to account for Medicaid expansion status in a study exploring these dynamics.
1.4. Present study
This study leverages two sources of variation—the UI‐eligible unemployment rate and the timing of FPUC payments—to explore whether the $600‐per‐week FPUC UI supplement moderated the impact of job loss on health care services spending in Medicaid expansion and nonexpansion states. It is the first to use a quasi‐exogenous interaction between state unemployment and the timing of FPUC implementation to examine the moderating effect of this unprecedented income transfer program on health care spending.
We anticipate that as an indicator of rising unemployment, the UI claim rate will be negatively associated with health care services spending. We expect this association to be stronger in nonexpansion states where access to Medicaid is more limited, consistent with existing research showing people in nonexpansion states were less likely to seek Covid‐related care than in expansion states. 32 We further expect FPUC to mitigate the negative association between the UI claims rate and health care spending, as those experiencing health problems allocate federal income support toward health care. This relationship should be stronger in nonexpansion states where low‐income adults are more likely to face higher out‐of‐pocket costs because they either lack health insurance or have less generous coverage. 33
2. METHODS
2.1. Data
Study data consist of 1581 state‐week observations for the 50 states and the District of Columbia, spanning 31 weeks from January 18 to August 15, 2020. We leverage novel aggregated and anonymized data on consumer debit and credit card purchases from Affinity Solutions, Inc. that Opportunity Insights made publicly available. 34 These data account for one‐tenth of all US credit and debit card purchases. Spending data were merged with state labor market data from the US Department of Labor and Bureau of Labor Statistics. We add publicly available data on state Covid cases drawn from The Covid Tracking Project at The Atlantic, made available by Opportunity Insights. Information on state stay‐at‐home orders and nonessential business closings was gathered through Opportunity Insights and The Institute for Health Metrics and Evaluation, respectively. 34 , 35 Data availability determined the study start date while we ended the study 2 weeks after FPUC lapsed but before the rollout of the confounding Lost Wages Assistance program. 36
2.2. Health care services spending
Our analysis investigates changes over the study period for an index of consumer credit and debit card spending on health care services. The index captures spending on regular visits to doctors and other health practitioners like dentists and optometrists, as well as ambulance services, visits to hospitals, and nursing home costs. Importantly, these data do not capture insurance premiums or prescription drugs purchased at retail outlets and so reflect copayments and other out‐of‐pocket expenses paid at the time of service or for past services. Opportunity Insights seasonally adjusted the spending data based on 2019 levels before indexing relative to mean January 2020 spending. Because the data were reported daily as 7‐day moving averages, we retained observations for the last day of the week (Saturday) to capture the average spending index for each week over the study period. The seasonally adjusted indices measure current health care services spending as a percent of weekly prepandemic purchase levels. A more detailed description of the health care spending data are available in the appendix and Opportunity Insights documentation. 34
2.3. Federal unemployment compensation program
We use a binary indicator for when the $600‐per‐week FPUC program was available to UI beneficiaries by state. We searched government press releases and news coverage to determine the week when payments became available (see Appendix Table A1). All states implemented the program between April 11 and May 2, 2020. The FPUC indicator was coded one starting with the implementation week through July 25, 2020, when the program ended and coded zero otherwise.
2.4. UI claims rate
We divided the number of continued claims for regular state UI benefits 37 for each week in the study period by the size of the 2019 state labor force and multiplied by 100 to capture the percentage of the labor force receiving regular state UI benefits each week.
2.5. New Covid case rate
We account for differences in the timing and severity of the Covid pandemic with two measures capturing the overall number of confirmed cases and the number of newly confirmed cases per 1000 people expressed as a seven‐day moving average. We only retained moving averages for Saturdays during the study period to match the spending indexes and weekly UI claims.
2.6. Economic impact payments (EIP)
The CARES Act also authorized lump‐sum EIPs for the majority of US residents. Payments were $1200 per adult and $500 for each dependent but phased out at higher incomes. Because EIP payments are potentially confounding, we included an indicator coded one for the 2 weeks ending April 18–April 25 when most payments occurred, and zero otherwise.
2.7. State policy changes
Most state governments responded to the early stages of the pandemic with a combination of mandatory statewide stay‐at‐home orders and nonessential business closings. We included two binary indicators for weeks when these mandates were in place. For instance, when orders started or ended in the middle of the week, the indicators reflect the fraction of days the order was in place. Only eight states did not institute a stay‐at‐home order. For remaining states, stay‐at‐home orders averaged 8 weeks, ranging from 3 to 21 weeks in length. Sixteen states did not have statewide nonessential business closings. Among the remaining states, statewide shutdowns of nonessential businesses averaged just under 8 weeks and extended up to 21 weeks.
2.8. Medicaid expansion
We generated binary indicators for the 36 states that had expanded Medicaid by the start of 2020. A complete listing of states by expansion status is listed in Table A1.
2.9. Analytic approach
We model health care spending as a function of the mean‐centered UI claims rate, the FPUC indicator, their interaction, and a set of controls. We estimated the effect of FPUC on household health care services with the following model:
| (1) |
where the outcome variable is household health care services spending measured as the percent of prepandemic spending in state s and week t; measures the percent of labor force claiming regular UI in state s in week t, centered with respect to the weighted mean UI claims rate; FPUC is an indicator variable equal to 1 from the week FPUC payments began in state s to July 25; EIP is an indicator variable equal to 1 for all weeks ending on April 18–25, 2020 when the majority of CARES Act lump‐sum payments were made; X is a vector of state‐level controls on the total and new Covid case rate in state s and week t and indicators for state policy changes; and are month and state fixed effects to control for time trends and state‐specific spending patterns; and is an idiosyncratic error term.
Our primary coefficient of interest is the parameter for the interaction term . The UI claims rate represents a shift in state unemployment directly impacting household spending, while FPUC serves as a moderator between the UI claims rate and average household spending in a state. Statistically, moderation would be evident from a positive interaction term. Our identification comes from two sources of variation within‐state change in the UI claims rate and the timing of FPUC payments. We argue that conditional on the timing of FPUC implementation, the UI claims rate, and the other controls in the model, the interaction between the UI claims rate and FPUC indicator offers quasi‐exogenous variation across states and time. This conditional exogeneity allows us to identify the moderating effect of FPUC on health care services spending.
Because states implemented FPUC over a short period, our identification relies primarily on variation in the UI claims rate, reflecting the share of the population treated by the FPUC program by state. For states with similar implementation dates, FPUC is expected to have a stronger effect in states with higher UI claims rates, where more workers received FPUC payments. As a measure of labor market hardship and loss of income, we anticipate that the UI claims rate will be negatively associated with health care spending, but that this relationship will be partially mitigated by added income through FPUC.
There is concern that the UI claims rate may have a different association with health care spending depending on unemployed workers' access to alternative health insurance options and the associated costs. We seek to address this concern by stratifying our results by state Medicaid expansion status. This stratification allows us to test if FPUC's moderating effect varies by a state's existing health policy landscape. Another concern is that the relationship between the UI claims and health care services spending rate may reflect the severity of the Covid pandemic in a state or other changes in state‐level policies, which could, in turn, influence household health care usage. It is also possible that the starting dates of the FPUC program were closely aligned with the lump‐sum EIPs, which could also have affected health care spending. For this reason, the model controls for potential state‐level confounders, including the Covid caseload, stay‐at‐home orders and business closings, and lump‐sum EIPs. Finally, the FPUC indicator may be capturing only period‐specific behavioral change and policy change unrelated to UI. If this were true, however, we would expect these changes to affect UI recipients and nonrecipients alike, yielding no significant interaction between the FPUC indicator and UI claims rate, our primary point estimate of interest. Applying a triple‐difference framework, the model includes state and month fixed effects to account for state‐ and period‐specific spending patterns.
3. RESULTS
Table 1 summarizes study variables for the 1581 state‐week observations. As shown, spending on health care services declined by an average of 19.9%, outpacing the 10.1% decline in overall spending. Meanwhile, FPUC benefits were available for approximately half of the study period while the UI claims rate averaged 7.4%. Previously, Chetty and colleagues used visuals to track changes in credit and debit card spending over the pandemic and the timing of the CARES Act implementation. 34 Figure 1 recreates this display for spending on health care services and all consumer goods and services for the study period spanning January 12–August 15, 2020. We add the shaded area to illustrate the sudden and dramatic rise in UI claims from 2 million in early March to 23 million in the second week of May. The vertical lines illustrate the approximate timing of the different federal interventions.
TABLE 1.
Population‐weighted summary statistics for study variables with means stratified by Medicaid expansion status, state‐week observations for January 18–August 15, 2020
| All states (n = 1581) | Mean | |||||
|---|---|---|---|---|---|---|
| Mean | Standard deviation | Min | Max | Medicaid expansion (n = 1116) | No Medicaid expansion (n = 465) | |
| Health care services spending index | −19.9 | 21.2 | −86.7 | 142.0 | −21.7 | −16.4 |
| All consumer spending index | −10.1 | 10.6 | −49.0 | 12.6 | −10.9 | −8.4 |
| Federal Pandemic Unemployment Compensation (FPUC) | 0.5 | – | 0.0 | 1.0 | 0.5 | 0.5 |
| Unemployment insurance (UI) claims rate a | 7.4 | 5.6 | 0.3 | 26.7 | 8.4 | 5.7 |
| Economic Impact Payments (EIPs) | 0.1 | – | 0.0 | 1.0 | 0.1 | 0.1 |
| Covid case rate (per 1000) | 4.4 | 5.9 | 0.0 | 28.9 | 4.7 | 3.8 |
| Covid new case rate (per 1000) | 0.1 | 0.1 | 0.0 | 0.6 | 0.1 | 0.1 |
| State stay‐at‐home order | 0.3 | 0.4 | 0.0 | 1.0 | 0.4 | 0.2 |
| State nonessential businesses closed | 0.2 | 0.4 | 0.0 | 1.0 | 0.3 | 0.1 |
| Medicaid expansion state | 0.7 | 0.5 | 0.0 | 1.0 | 1.0 | 0.0 |
The UI claims rate was centered based on the population‐weighted mean in all regression models, but uncentered values are displayed here. The last two columns display the weighted means stratified by whether states implemented the Affordable Care Act (ACA) Medicaid expansion by January 2020.
Source: Authors' analysis of study data.
FIGURE 1.
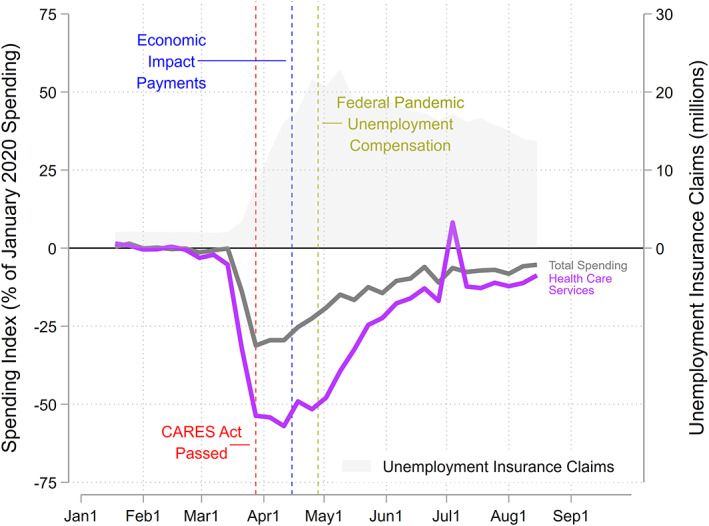
Weekly index of debit and credit card spending on all goods and services and health care services for the weeks ending January 18–August 15, 2020. Note: The Federal Pandemic Unemployment Compensation program was available in all states for the weeks ending May 2–July 25, 2020. Number of unemployment insurance (UI) claims in millions are shaded gray and displayed on the right axis. Although the data are seasonally adjusted, there is a notable spike in health care services spending that coincides with the July 4th holiday. Source: Authors' analysis of study data [Color figure can be viewed at wileyonlinelibrary.com]
Figure 1 shows that spending was relatively flat through the end of February when the US reported what was then believed to be its first Covid fatality. 38 Health care spending then plummeted by more than half relative to prepandemic levels toward the end of March. The drop in health care spending was more dramatic than for all consumer spending over the same period. Figure 1 shows the major decline in both overall and health care service spending halted abruptly with the passage of the CARES Act. As income supports from EIPs and FPUC benefits rolled out in mid to late April, spending regained ground rapidly. Although overall and health care services spending remained below prepandemic levels through the end of the study period, spending stabilized at levels far higher than those seen before the CARES Act.
In Table 2, we present results from regression analyses to provide a rigorous test of our hypothesis that FPUC mitigated spending cuts on health care services. The first column shows the estimated coefficients for fixed effects models predicting the health care spending index for all states. Overall, the covariates operate largely as expected. State stay‐at‐home orders and nonessential business closures both reduced spending, while EIPs were associated with a large increase in both health care spending and all spending.
TABLE 2.
Ordinary least‐squares (OLS) models predicting debit and credit card spending on health care services and all consumer spending on goods and services for January 18–August 15, 2020, stratified by Medicaid expansion status
| Health care services spending | All consumer spending | ||||
|---|---|---|---|---|---|
| All states | Medicaid expansion | No Medicaid expansion | Medicaid expansion | No Medicaid expansion | |
| (1) | (2) | (3) | (4) | (5) | |
| FPUC | −2.9 | −5.7* | −5.8* | −2.4 | −0.2 |
| [−8.4,2.6] | [−11.2,−0.1] | [−11.5,−0.09] | [−6.4,1.7] | [−2.1,1.6] | |
| UI claims rate | −1.0* | −1.0* | −2.0** | −0.8* | −1.7** |
| [−1.8,−0.2] | [−1.8,−0.2] | [−3.3,−0.8] | [−1.4,−0.2] | [−2.6,−0.7] | |
| UI claims rate × FPUC | 0.5 + | 0.8*** | 1.3* | 0.8*** | 1.3** |
| [−0.05,1.0] | [0.4,1.2] | [0.0008,2.5] | [0.4,1.2] | [0.5,2.0] | |
| EIP | 10.5*** | 10.0** | 20.0*** | 6.9*** | 10.9*** |
| [6.2,14.7] | [4.4,15.7] | [15.5,24.5] | [3.6,10.3] | [8.2,13.5] | |
| UI claims rate × EIP | 0.2 | −0.07 | 0.7* | −0.1 | −0.3 |
| [−0.4,0.9] | [−0.8,0.7] | [0.2,1.2] | [−0.4,0.2] | [−0.7,0.2] | |
| Covid case rate | −0.3 + | −0.2 | −0.09 | 0.1 | 0.3 |
| [−0.6,0.01] | [−0.6,0.2] | [−0.6,0.5] | [−0.1,0.3] | [−0.07,0.7] | |
| Covid new case rate | −2.3 | −3.1 | −5.5 | 2.4 | −10.2* |
| [−15.2,10.5] | [−29.5,23.3] | [−25.6,14.5] | [−14.2,19.0] | [−17.7,−2.8] | |
| State stay‐at‐home order | −10.5*** | −5.6 + | −13.8*** | −4.2** | −2.4** |
| [−15.5,−5.5] | [−11.5,0.4] | [−16.0,−11.6] | [−6.9,−1.5] | [−3.9,−0.9] | |
| Nonessential businesses closed | −4.6* | −9.0*** | 3.2 | −7.3*** | 2.3 |
| [−8.9,−0.2] | [−14.0,−4.0] | [−5.2,11.5] | [−11.3,−3.4] | [−4.4,8.9] | |
| State fixed effect | Yes | Yes | Yes | Yes | Yes |
| Month fixed effect | Yes | Yes | Yes | Yes | Yes |
| Observations | 1581 | 1116 | 465 | 1116 | 465 |
| R‐squared | 0.74 | 0.76 | 0.73 | 0.76 | 0.70 |
Note: FPUC is a binary indicator for the $600 per week supplemental unemployment benefits which were available in all states for the weeks of May 2–July 25, 2020. The UI claims rate was centered relative to the population‐weighted mean for all states. Standard errors clustered by state. 95% Confidence intervals in brackets.
Abbreviations: EIP, economic impact payment; FPUC, federal pandemic unemployment compensation; UI, unemployment insurance.
p < 0.10;
p < 0.05;
p < 0.01;
p < 0.001.
Before FPUC was in place, health services spending declined by 1.0% for every percentage point increase in the UI claims rate, as compared to prepandemic levels. The UI claims rate and FPUC interaction term shows that FPUC moderated the relationship between the UI claims rate and health care spending. Specifically, the marginally significant 0.5 coefficient suggests that the FPUC program mitigated half of the 1.0% spending decline associated with each percentage point increase in the UI claims rate.
The next two columns present separate models for Medicaid expansion and nonexpansion states. We hypothesized that the UI claims rate will have a stronger negative association with health care spending in nonexpansion states, but that the FPUC program will also have a larger impact offsetting this association. Column 2 shows that a percentage point increase in the UI claims rate was associated with a 1.0% (<0.05) reduction in health care services spending for expansion states when FPUC was not in place. Consistent with our hypothesis, column three shows the corresponding relationship was twice as large in nonexpansion states where a percentage point increase in the UI claims rate was associated with a 2.0% (<0.01) decline in health care services spending. Although the UI claims rate and FPUC interaction terms were significant for both expansion and nonexpansion states, the coefficient was larger in nonexpansion states (1.3, <0.05) than in expansion states (0.8, <0.001). Similarly, the Economic Impact Payment (EIP) main effect and interaction with the UI claims rate were both larger for nonexpansion states, further evidence that federal income transfers had more of an impact on health care spending in nonexpansion states where the unemployed were more likely to be uninsured or have less comprehensive coverage. In contrast to FPUC, the EIP and UI claims rate interaction was not consistently related to health care or all spending, in line with EIPs not being conditional on unemployment.
Columns 4 and 5 replicate the main results including the EIP and UI claims rate interaction for total consumer credit and debit card spending. We anticipated that these results would mirror those for health care spending but with smaller differences between expansion and nonexpansion states. These columns show that the UI claims rate was negatively associated with all spending when the FPUC program was not in place, but the magnitude of the coefficients was smaller than for health care services spending, consistent with the descriptive time trend seen in Figure 1. Contrary to expectations, differences between expansion and nonexpansion states persisted for the all‐spending outcome. This may be because model controls did not fully account for differences in the generosity of social welfare benefits between expansion and nonexpansion states. For example, the average weekly UI benefit in expansion states was $551 in 2020 relative to $380 in nonexpansion states. Thus, in nonexpansion states, the negative effects of the UI claims rate and subsequent introduction of FPUC benefits may have been more consequential for health care spending as well as all consumer spending.
It is also possible that the state policy control variables did not adequately account for state differences in political ideology that may influence Medicaid expansion as well as behavioral and policy responses to Covid. In Table 3, we repeat the analysis for health care spending but stratify by governor party affiliation in the first two columns and the 2016 presidential election vote in the last two columns. In both pairs of models, the main effects for the UI claims rate were more similar than they were for the Medicaid expansion stratification, while the interaction effects were nearly indistinguishable. These results provide further evidence that Medicaid expansion status is not simply acting as a proxy for state political ideology but rather a different policy environment.
TABLE 3.
Ordinary least‐squares (OLS) models predicting debit and credit card spending on health care services for January 18–August 15, 2020, stratified by political context
| Health care services spending | ||||
|---|---|---|---|---|
| 2016 Presidential election | ||||
| Democratic governor | Republican governor | Clinton | Trump | |
| (1) | (2) | (3) | (4) | |
| FPUC | −4.8 + | −4.7 | −2.9 | −6.6 |
| [−9.6,0.02] | [−16.2,6.8] | [−8.4,2.5] | [−14.8,1.6] | |
| UI claims rate | −1.1** | −1.6** | −1.4*** | −1.6** |
| [−1.9,−0.4] | [−2.8,−0.5] | [−2.0,−0.7] | [−2.6,−0.6] | |
| UI claims rate × FPUC | 0.9*** | 0.8 + | 1.1*** | 1.0* |
| [0.4,1.3] | [−0.1,1.8] | [0.7,1.4] | [0.06,1.9] | |
| State fixed effect | Yes | Yes | Yes | Yes |
| Month fixed effect | Yes | Yes | Yes | Yes |
| Full set of controls | Yes | Yes | Yes | Yes |
| Observations | 775 | 806 | 651 | 930 |
| R‐squared | 0.78 | 0.71 | 0.79 | 0.72 |
Note: FPUC is a binary indicator for the $600 per week supplemental unemployment benefits which were available in all states for the weeks of May 2–July 25, 2020. The UI claims rate was centered relative to the population‐weighted mean for all states. Models include all control variables in Table 2. Models are stratified based on if a state had a Democratic or Republican governor in January 2020 and if a state voted for Hillary Clinton or Donald Trump in the 2016 presidential election. Standard errors clustered by state. 95% Confidence intervals in brackets.
Abbreviations: FPUC, federal pandemic unemployment compensation; UI, unemployment insurance.
p < 0.10;
p < 0.05;
p < 0.01;
p < 0.001.
Source: Authors' analysis of study data.
4. DISCUSSION
This study leverages novel, newly available data on credit and debit card purchases to estimate the buffering effects of expanded UI benefits on declines in health care services spending during the Covid pandemic. During a period of massive job loss, expanded UI through the FPUC program injected $321 billion into state economies. 39 Spending on health care services plummeted at the onset of the pandemic but stabilized following CARES Act enactment and rose rapidly following the rollout of EIP and FPUC payments. Our models reveal that for all states, a percentage point increase in the UI claims rate was associated with a 1.0% decline in health care services spending, but FPUC payments mitigated half of this negative association. We further show that this negative relationship between job loss and health care services spending was larger for states that did not expand Medicaid. The same is true of the moderating effect of FPUC. Our findings suggest that FPUC compensated for health care coverage gaps, particularly in nonexpansion states.
The present study contributes to a growing body of research investigating the relationship between social welfare policy and health outcomes. Recent studies have identified positive effects of the Supplement Nutrition Assistance Program on child health and development 40 and in moderating the harmful effects of food insecurity on the physical health of older adults. 41 Other studies have found that UI mitigates the negative health effects of job loss: generous UI benefits are associated with improved self‐reported health, lower suicide rates, greater physical activity among the unemployed, and greater health insurance coverage and utilization. 42 , 43 , 44 , 45 The present study supplements this research by illustrating the potential for UI to interact with state‐level health care policy to protect health care spending.
4.1. Limitations
The novel credit and debit card data allowed us to track real‐time spending changes but have several limitations. First, it is important not to conflate health care spending with utilization. For example, the loss of health insurance or a transition to less generous coverage could increase out‐of‐pocket costs or reliance on credit card purchases. Thus, utilization may have recovered more slowly than reflected by spending data. Likewise, spending could reflect efforts to catch up on past medical bills. Second, the aggregate measure of spending used here may mask heterogeneity between health care service types and households. For example, we were unable to distinguish hospital visits from routine screenings or capture health insurance premiums, insurer spending, and retail prescription drug purchases. FPUC and EIPs may have been less effective for vulnerable households who had greater difficulty accessing these benefits. 46 Credit and debit card data may not reflect changes in spending for low‐income households that are less likely to access such financial products; although, an estimated four‐fifths of the lowest‐income households have a debit or credit card. 47 Third, in this time of great uncertainty and flux, our models may have inadequately controlled for subtle policy and behavioral changes (e.g., school closings and confidence in protective measures like masks) or changes in the composition of the unemployed that were possibly correlated with the FPUC rollout. For example, unemployed workers could be more risk‐averse and responsive to changes in public health measures. Although it is unclear why policy or behavioral changes would disproportionately influence UI recipients, a differential response could bias the interaction term upward. Yet despite these limitations, the spending data available in real‐time complement survey‐based assessments of hardship, which may be influenced by subjectivity and are not ideally suited for capturing real‐time policy change.
5. CONCLUSION
Our study provides evidence that FPUC payments enabled households to meet health care spending needs in the face of uncertainty. It contributes to a growing body of evidence that federal income support programs can mitigate hardship during economic crises. 20 , 21 Yet the reality that a temporary federal program bolstered health care spending during a public health and economic crisis underscores the perils of a fragmented and costly health care system that ties coverage to employment for working‐age people and fails to provide universal coverage. The time‐limited nature of the federal intervention and observed differences between Medicaid expansion and nonexpansion states suggests a need for permanent policy structures to improve access to health care.
ACKNOWLEDGMENTS
Joint Acknowledgment/Disclosure Statement: We would like to thank the three anonymous reviewers for their helpful comments that improved the manuscript. The authors' time for this project was supported with funding from Poverty Solutions at the University of Michigan. H. Luke Shaefer is the director of Poverty Solutions, which receives funding from multiple sources. Internal University of Michigan resources supported Michael Evangelist's and Pinghui Wu's time on this project. There are no conflicts of interest to disclose.
Shaefer has written 3 essays that review the evidence on the impact of unemployment insurance expansion during the COVID pandemic on expenditures and other outcomes. None of these discuss health care expenditures specifically.
Cooney, P. & Shaefer, H.L. (June 24, 2021). “Extra unemployment aid has helped keep Michigan's economy humming: Don't end it now.” Detroit Free Press.
Cooney, P. & Shaefer, H.L. (March 31, 2021). “We learned something in the pandemic: Government matters.” Bridge.
Shaefer, H.L. (October 1, 2020). “When government works: Michigan's response to COVID's economic crisis.” Bridge.
APPENDIX A.
Data description
Data on credit and debit card spending on health care services and all consumer purchases come from Affinity Solutions and were made publicly available by the Opportunity Insights (OI) Team at Harvard University. An OI working paper provides a detailed explanation of the Affinity Solutions data and methodology used to calculate the daily credit and debit card spending. 34 Here, we draw on the working paper and email communications with OI to provide a more complete explanation of the spending data than what was included in the main text.
First, the health care services spending data include the following Merchant Category Codes (MCCs):
4119 – Ambulance Services.
8011 – Doctors ‐ not elsewhere classified.
8021 – Dentists, Orthodontists.
8031 – Osteopathic Physicians.
8041 – Chiropractors.
8042 – Optometrists, Ophthalmologists.
8043 – Opticians, Optical Goods, and Eyeglasses.
8049 – Chiropodists, Podiatrists.
8050 – Nursing and Personal Care Facilities.
8062 – Hospitals.
8071 – Dental and Medical Laboratories.
8099 – Health Practitioners, Medical Services – not elsewhere classified.
Notably, these data include several categories that likely capture nonessential health care services, for example, cosmetic dentistry. The data also exclude payments covering health insurance premiums and prescription drugs purchased through retail pharmacies. The aggregate nature of these data does not permit us to separate the MCCs or to focus on specific categories like doctors or hospitals. Nonetheless, the data are capturing spending for copayments and out‐of‐pocket costs associated with these types of medical expenditures.
As the OI paper describes, the Affinity Solutions data capture about 10% of all debit and credit card spending in the United States and date back to January 1, 2019. These data are disaggregated by county. OI constructed daily spending averages based on spending averaged across the current day and each of the previous 6 days. The data were then adjusted for seasonality by dividing the 2020 daily values by the corresponding daily values for 2019. Finally, OI generated spending indices by dividing the seasonally adjusted daily spending values by the mean seasonally adjusted spending level for January 4–31, 2020. We retained only the Saturday 7‐day averages, which correspond with the weekly unemployment insurance claims data. Although there is concern that the Affinity Solutions data exclude cash payments, OI cites research showing that cash transactions account for just 6.3% of consumer spending in the United States.
TABLE A1.
Summary of Medicaid expansion status as of January 2020, federal pandemic unemployment compensation implementation dates, and start and end dates for state stay at home orders and nonessential business closings
| State | Medicaid expansion a | Federal pandemic unemployment insurance b | State stay at home order c | Nonessential business closings d | ||
|---|---|---|---|---|---|---|
| Start | End | Start | End | |||
| Alabama | No | 4/11/2020 | 4/4/2020 | 4/30/2020 | 3/28/2020 | 4/30/2020 |
| Alaska | Yes | 4/18/2020 | 3/28/2020 | 4/24/2020 | 3/28/2020 | 4/24/2020 |
| Arizona | Yes | 4/18/2020 | 3/31/2020 | 5/15/2020 | ||
| Arkansas | Yes | 4/11/2020 | ||||
| California | Yes | 4/18/2020 | 3/19/2020 | 3/19/2020 | 9/2/2020 | |
| Colorado | Yes | 4/25/2020 | 3/26/2020 | 5/9/2020 | 3/26/2020 | 5/9/2020 |
| Connecticut | Yes | 4/25/2020 | 3/23/2020 | 5/20/2020 | 3/23/2020 | 5/20/2020 |
| Delaware | Yes | 4/11/2020 | 3/24/2020 | 5/31/2020 | 3/24/2020 | 5/8/2020 |
| District of Columbia | Yes | 4/25/2020 | 4/1/2020 | 5/29/2020 | 3/25/2020 | 5/29/2020 |
| Florida | No | 4/18/2020 | 4/3/2020 | 5/18/2020 | ||
| Georgia | No | 4/18/2020 | 4/3/2020 | 4/30/2020 | ||
| Hawaii | Yes | 4/25/2020 | 3/25/2020 | 5/31/2020 | 3/25/2020 | 5/1/2020 |
| Idaho | Yes | 5/2/2020 | 3/25/2020 | 4/30/2020 | 3/25/2020 | 5/1/2020 |
| Illinois | Yes | 4/11/2020 | 3/21/2020 | 5/29/2020 | 3/21/2020 | 5/1/2020 |
| Indiana | Yes | 4/18/2020 | 3/24/2020 | 5/18/2020 | 3/24/2020 | 5/18/2020 |
| Iowa | Yes | 4/18/2020 | 3/17/2020 | 5/8/2020 | ||
| Kansas | No | 4/25/2020 | 3/30/2020 | 5/22/2020 | ||
| Kentucky | Yes | 4/11/2020 | 3/26/2020 | 5/11/2020 | 3/26/2020 | 5/11/2020 |
| Louisiana | Yes | 4/18/2020 | 3/23/2020 | 5/16/2020 | 3/22/2020 | 5/1/2020 |
| Maine | Yes | 4/18/2020 | 4/2/2020 | 5/31/2020 | 3/25/2020 | 5/1/2020 |
| Maryland | Yes | 4/18/2020 | 3/30/2020 | 6/1/2020 | 3/23/2020 | 5/15/2020 |
| Massachusetts | Yes | 4/11/2020 | 3/24/2020 | 5/18/2020 | 3/24/2020 | 5/18/2020 |
| Michigan | Yes | 4/11/2020 | 3/24/2020 | 6/1/2020 | 3/23/2020 | 5/7/2020 |
| Minnesota | Yes | 4/11/2020 | 3/27/2020 | 5/17/2020 | ||
| Mississippi | No | 4/11/2020 | 4/3/2020 | 4/27/2020 | 4/3/2020 | 4/27/2020 |
| Missouri | No e | 4/18/2020 | 4/6/2020 | 5/18/2020 | ||
| Montana | Yes | 4/18/2020 | 3/28/2020 | 4/26/2020 | 3/26/2020 | 5/1/2020 |
| Nebraska | No f | 4/18/2020 | ||||
| Nevada | Yes | 4/18/2020 | 4/1/2020 | 5/9/2020 | 3/21/2020 | 5/9/2020 |
| New Hampshire | Yes | 4/18/2020 | 3/27/2020 | 6/15/2020 | 3/28/2020 | 5/11/2020 |
| New Jersey | Yes | 4/18/2020 | 3/21/2020 | 6/9/2020 | 3/21/2020 | 5/2/2020 |
| New Mexico | Yes | 4/25/2020 | 3/24/2020 | 5/31/2020 | 3/24/2020 | 5/15/2020 |
| New York | Yes | 4/11/2020 | 3/22/2020 | 5/28/2020 | 3/22/2020 | 6/8/2020 |
| North Carolina | No | 4/18/2020 | 3/30/2020 | 5/22/2020 | 3/30/2020 | 5/8/2020 |
| North Dakota | Yes | 4/18/2020 | ||||
| Ohio | Yes | 4/25/2020 | 3/23/2020 | 5/29/2020 | 3/23/2020 | 5/4/2020 |
| Oklahoma | No g | 4/11/2020 | 4/1/2020 | 4/24/2020 | ||
| Oregon | Yes | 4/11/2020 | 3/23/2020 | |||
| Pennsylvania | Yes | 4/11/2020 | 4/1/2020 | 6/5/2020 | 3/23/2020 | 5/8/2020 |
| Rhode Island | Yes | 4/11/2020 | 3/28/2020 | 5/8/2020 | ||
| South Carolina | No | 4/18/2020 | 4/7/2020 | 5/4/2020 | ||
| South Dakota | No | 4/11/2020 | ||||
| Tennessee | No | 4/18/2020 | 3/31/2020 | 5/11/2020 | 4/1/2020 | 5/26/2020 |
| Texas | No | 4/18/2020 | 4/2/2020 | 4/30/2020 | ||
| Utah | Yes | 4/11/2020 | ||||
| Vermont | Yes | 4/11/2020 | 3/25/2020 | 5/15/2020 | 3/25/2020 | 5/4/2020 |
| Virginia | Yes | 4/18/2020 | 3/30/2020 | 6/10/2020 | 3/24/2020 | 5/15/2020 |
| Washington | Yes | 4/25/2020 | 3/23/2020 | 5/31/2020 | 3/25/2020 | 7/3/2020 |
| West Virginia | Yes | 4/11/2020 | 3/24/2020 | 5/3/2020 | 3/24/2020 | 5/4/2020 |
| Wisconsin | No | 5/2/2020 | 3/25/2020 | 5/26/2020 | 3/25/2020 | 5/11/2020 |
| Wyoming | No | 4/18/2020 | ||||
Kaiser Family Foundation. Status of State Medicaid Expansion Decisions: Interactive Map. Published May 26, 2021. https://www.kff.org/medicaid/issue‐brief/status‐of‐state‐medicaid‐expansion‐decisions‐interactive‐map/. Accessed June 4, 2021.
Based on authors' analysis of state workforce agency websites and news reports. Dates are for the Saturday of the week that Federal Pandemic Unemployment Compensation was implemented in each state.
Reference 34.
The Institute for Health Metrics and Evaluation. Covid‐19 Estimates for May 28, 2021. http://www.healthdata.org/covid/data‐downloads. Accessed June 19, 2021.
On August 4, 2020, Missouri voters approved a ballot measure to adopt Medicaid expansion, but the expansion was not implemented during the study period.
Nebraska implemented the Medicaid expansion in October 2020, after the end of the study period.
On June 30, 2020, Oklahoma voters approved a ballot measure to adopt Medicaid expansion, but the expansion was not implemented during the study period.
Evangelist M, Wu P, Shaefer HL. Emergency unemployment benefits and health care spending during Covid. Health Serv Res. 2022;57(1):15‐26. 10.1111/1475-6773.13772
Footnotes
Per email communication with the Opportunity Insights Team dated September 1, 2020.
REFERENCES
- 1. Woolf SH, Chapman DA, Sabo RT, Weinberger DM, Hill L. Excess deaths from COVID‐19 and other causes, March‐April 2020. JAMA. 2020;324(5):510‐513. [DOI] [PMC free article] [PubMed] [Google Scholar]
- 2. Lange SJ, Ritchey MD, Goodman AB, et al. Potential indirect effects of the COVID‐19 pandemic on use of emergency departments for acute life‐threatening conditions—United States, January–May 2020. Am J Transplant. 2020;20(9):2612‐2617. [DOI] [PMC free article] [PubMed] [Google Scholar]
- 3. Santoli JM, Lindley MC, DeSilva MB, et al. Effects of the COVID‐19 pandemic on routine pediatric vaccine ordering and administration—United States, 2020. MMWR Morb Mortal Wkly Rep. 2020;69(19):591‐593. [DOI] [PubMed] [Google Scholar]
- 4. Kansagra AP, Goyal MS, Hamilton S, Albers GW. Collateral effect of Covid‐19 on stroke evaluation in the United States. N Engl J Med. 2020;383(4):400‐401. [DOI] [PMC free article] [PubMed] [Google Scholar]
- 5. Bhatt AS, Moscone A, McElrath EE, et al. Fewer hospitalizations for acute cardiovascular conditions during the COVID‐19 pandemic. J Am Coll Cardiol. 2020;76(3):280‐288. [DOI] [PMC free article] [PubMed] [Google Scholar]
- 6. Solomon MD, McNulty EJ, Rana JS, et al. The Covid‐19 pandemic and the incidence of acute myocardial infarction. N Engl J Med. 2020;383(7):691‐693. [DOI] [PubMed] [Google Scholar]
- 7. Mehrotra A, Chernew M, Linetsky D, Hatch H, Cutler D, Schneider EC. The Impact of the COVID‐19 Pandemic on Outpatient Visits: Changing Patterns of Care in the Newest COVID‐19 Hot Spots. New York, NY: The Commonwealth Fund; 2020. [Google Scholar]
- 8. Martin K, Kurowski D, Given P, Kennedy K, Clayton E. The Impact of COVID‐19 on the Use of Preventive Health Care. Washington, DC: Health Care Cost Institute; 2020. [Google Scholar]
- 9. Hamel L, Kearney A, Kirzinger A, Lopes L, Muñana C, Brodie M. Impact of Coronavirus on Personal Health, Economic and Food Security, and Medicaid. Washington, DC: Kaiser Family Foundation; 2020. [Google Scholar]
- 10. Bramer CA, Kimmins LM, Swanson R, et al. Decline in child vaccination coverage during the COVID‐19 pandemic—Michigan care improvement registry, May 2016–May 2020. MMWR Morb Mortal Wkly Rep. 2020;69(20):630‐631. [DOI] [PubMed] [Google Scholar]
- 11. Planalp C, Alarcon G, Blewett LA. Coronavirus Pandemic Caused More than 10 Million U.S. Adults to Lose Health Insurance. Minneapolis, MN: State Health Access Data Assistance Center; 2020. [Google Scholar]
- 12. Gonzalez D, Zuckerman S, Kenney GM, Karpman M. Almost Half of Adults in Families Losing Work during the Pandemic Avoided Health Care because of Cost or COVID‐19 Concerns. Washington, DC: Urban Institute; 2020. [Google Scholar]
- 13. Karpman M, Zuckerman S, Gonzalez D, Kenney GM. The COVID‐19 Pandemic is Straining families' Abilities to Afford Basic Needs. Washington, DC: Urban Institute; 2020. [Google Scholar]
- 14. Montenovo L, Jiang X, Rojas FL, et al. Determinants of disparities in COVID‐19 job losses. National Bureau of Economic Research Working Paper Series; Cambridge, MA: National Bureau of Economic Research; 2020. Working Paper No. 27132. [Google Scholar]
- 15. Ganong P, Noel PJ, Vavra JS. US unemployment insurance replacement rates during the pandemic. National Bureau of Economic Research Working Paper Series; Cambridge, MA: National Bureau of Economic Research; 2020. Working Paper No. 27216. [DOI] [PMC free article] [PubMed] [Google Scholar]
- 16. Policy Basics: the Supplemental Nutrition Assistance Program (SNAP). Washington, DC: Center on Budget and Policy Priorities; 2019. [Google Scholar]
- 17. Han J, Meyer BD, Sullivan JX. Income and poverty in the COVID‐19 pandemic. Brookings Papers Econ Activity. 2020;2020:85‐118. [Google Scholar]
- 18.Cortes GM, Forsythe E. Impacts of the COVID‐19 pandemic and the CARES act on earnings and inequality. Employment Research. 2020;27(4):4‐7. [Google Scholar]
- 19. Bachas N, Ganong P, Noel PJ, et al. Initial impacts of the pandemic on consumer behavior: evidence from linked income, spending, and savings data. National Bureau of Economic Research Working Paper Series; Cambridge, MA: National Bureau of Economic Research; 2020. Working Paper No. 27617. [Google Scholar]
- 20. Shaefer HL, Cooney P, Rodems R, Mattingly MJ. Hardship and Well‐Being in the United States after the CARES Act. Ann Arbor, MI: Poverty Solutions at the University of Michigan; 2020. [Google Scholar]
- 21. Parolin Z, Curran MA, Matsudaira J, Waldfogel J, Wimer C. Monthly Poverty Rates in the United States During the COVID‐19 Pandemic. New York, NY: Center on Poverty & Social Policy at Columbia University; 2020. [Google Scholar]
- 22. Grinstein‐Weiss M, Gupta B, Chun Y, Lee H & Despard M Housing hardships reach unprecedented heights during the COVID‐19 pandemic. Up Front 2020. Accessed June 1, 2020.
- 23. Cox DA. Hardship, Anxiety, and Optimism: Racial and Partisan Disparities in Americans' Response to COVID‐19. Washington, DC: American Enterprise Institute; 2020. [Google Scholar]
- 24. Karpman M, Acs G. Unemployment Insurance and Economic Impact Payments Associated with Reduced Hardship Following CARES Act. Washington, DC: Urban Institute; 2020. [Google Scholar]
- 25. Gangopadhyaya A, Karpman M, Aarons J. As the COVID‐19 Recession Extended into the Summer of 2020, More than 3 Million Adults Lost Employer‐Sponsored Health Insurance Coverage and 2 Million Became Uninsured. Washington, DC: Urban Institute; 2020. [Google Scholar]
- 26. McDermott D, Cox C, Rudowitz R, Garfield R. How Has the Pandemic Affected Health Coverage in the U.S.?. Washington, DC: Kaiser Family Foundation; 2020. [Google Scholar]
- 27. Corallo B, Rudowtiz R. Analysis of Recent National Trends in Medicaid and CHIP Enrollment. Washington, DC: Kaiser Family Foundation; 2021. [Google Scholar]
- 28. Gee E, Waldrop T. Policies to Improve Health Insurance Coverage as America Recovers from COVID‐19. Washington, DC: Center for American Progress; 2021. [Google Scholar]
- 29. Karpman M, Zuckerman S, Petersen G. Adults in Families Losing Jobs during the Pandemic Also Lost Employer‐Sponsored Health Insurance. Washington, DC: Urban Institute; 2020. [Google Scholar]
- 30. Garfield R, Claxton G, Damico A, Levitt L. Eligibility for ACA Health Coverage Following Job Loss. Washington, DC: Kaiser Family Foundation; 2020. [Google Scholar]
- 31. Agarwal SD, Sommers BD. Insurance coverage after job loss—the importance of the ACA during the Covid‐associated recession. N Engl J Med. 2020;383(17):1603‐1606. [DOI] [PubMed] [Google Scholar]
- 32. Chakrabarti R, Meyerson L, Nober W, Pinkovskiy M. The Affordable Care Act and the COVID‐19 Pandemic: A Regression Discontinuity Analysis. New York, NY: Federal Reserve Bank of New York; 2020. [Google Scholar]
- 33. Glied SA, Chakraborty O, Russo T. How Medicaid Expansion Affected out‐of‐Pocket Health Care Spending for Low‐Income Families. New York, NY: The Commonwealth Fund; 2017. [PubMed] [Google Scholar]
- 34. Chetty R, Friedman JN, Hendren N, Stepner M. The economic impacts of COVID‐19: evidence from a new public database built using private sector data. National Bureau of Economic Research Working Paper Series; Cambridge, MA: National Bureau of Economic Research; 2020. Working Paper No. 27431. [DOI] [PMC free article] [PubMed] [Google Scholar]
- 35. COVID‐19 Projections. Seattle, WA: The Institute for Health Metrics and Evaluation, University of Washington; 2021. [Google Scholar]
- 36. Luhby T. Arizonans are first to receive Trump's unemployment benefits. CNN. 2020. https://www.cnn.com/2020/08/21/politics/trump-unemployment-benefits-arizona/index.html [Google Scholar]
- 37. U.S. Department of Labor . ETA 539 Weekly Claims and Extended Benefits Trigger Data. Washington, DC: U.S. Department of Labor, Employment & Training Administration; 2021. [Google Scholar]
- 38. Taylor DB. A timeline of the coronavirus pandemic. New York Times. https://www.nytimes.com/article/coronavirus-timeline.html (2021, March 17).
- 39. Families First Coronavirus Response Act and Coronavirus Aid, Relief, and Economic Security (CARES) Act Funding to States through February 27, 2021. Washington, DC: U.S. Department of Labor; 2020. [Google Scholar]
- 40. East CN. The effect of food stamps on children's health: evidence from immigrants' changing eligibility. J Hum Resour. 2020;55(2):387‐427. [Google Scholar]
- 41. Pak T‐Y, Kim G. Food stamps, food insecurity, and health outcomes among elderly Americans. Prev Med. 2020;130:105871. [DOI] [PubMed] [Google Scholar]
- 42. Cylus J, Glymour MM, Avendano M. Do generous unemployment benefit programs reduce suicide rates? A state fixed‐effect analysis covering 1968–2008. Am J Epidemiol. 2014;180(1):45‐52. [DOI] [PMC free article] [PubMed] [Google Scholar]
- 43. Cylus J, Glymour MM, Avendano M. Health effects of unemployment benefit program generosity. Am J Public Health. 2015;105(2):317‐323. [DOI] [PMC free article] [PubMed] [Google Scholar]
- 44. Cylus J. Unemployment insurance and physical activity. In: Bolin K, Lindgren B, Grossman M, et al., eds. Human Capital and Health Behavior: Advances in Health Economics and Health Services Research. Bingley, UK: Emerald Publishing; 2017:245‐277. [Google Scholar]
- 45. Kuka E. Quantifying the benefits of social insurance: unemployment insurance and health. Rev Econ Stat. 2020;102(3):490‐505. [Google Scholar]
- 46. Bitler M, Hoynes H, Schanzenbach DW. The social safety net in the wake of COVID‐19. Brookings Papers Econ Activity. 2020;2020:119‐158. [Google Scholar]
- 47. Shy Oz. Low‐income consumers and payment choice. Research in Economics. 2020;74(4):292‐300. [Google Scholar]