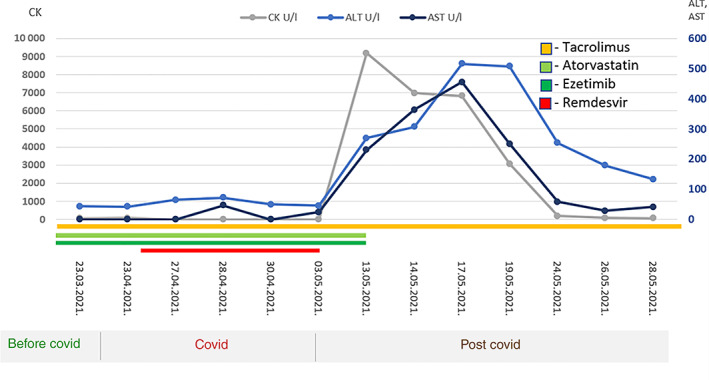
FIGURE 1.

Changes in CK, ALT, and AST values over time, relative to drug administration and exclusion (remdesivir, atorvastatin, ezetimibe, and tacrolimus)

Changes in CK, ALT, and AST values over time, relative to drug administration and exclusion (remdesivir, atorvastatin, ezetimibe, and tacrolimus)