
FIGURE 2.
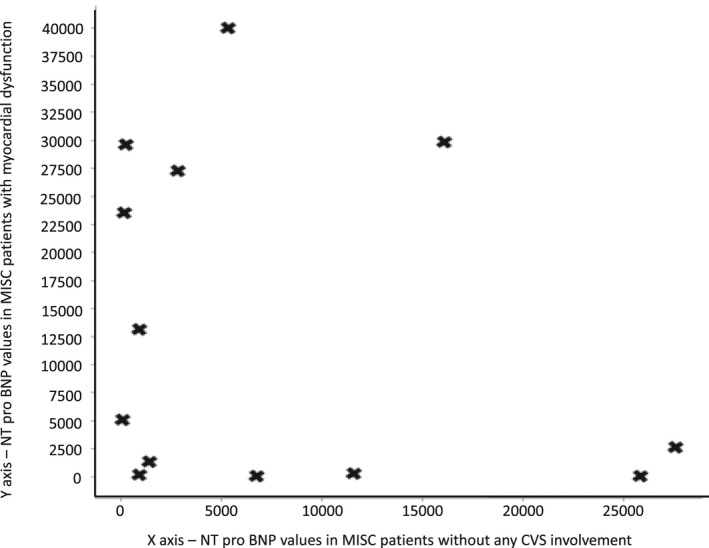
Scatter plot to show ‐terminal probrain natriuretic peptide (NT‐proBNP) values in patients with and without myocardial dysfunction
Official websites use .gov
A
.gov website belongs to an official
government organization in the United States.
Secure .gov websites use HTTPS
A lock (
) or https:// means you've safely
connected to the .gov website. Share sensitive
information only on official, secure websites.
Scatter plot to show ‐terminal probrain natriuretic peptide (NT‐proBNP) values in patients with and without myocardial dysfunction