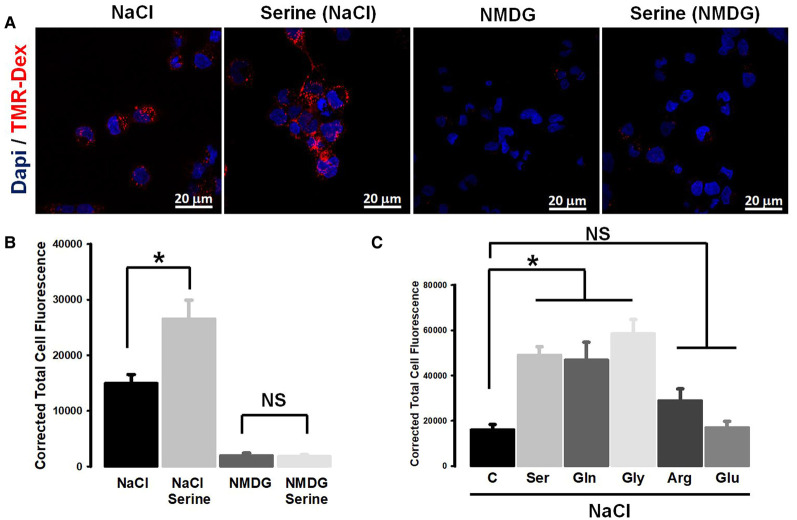
Figure 7. Promotion of macropinocytosis by SLC38A5-mediated transport function in the TNBC cell line TXBR-100.
(A) Cells were incubated in buffers (pH 7.5) containing NaCl (Na+-buffer) or NMDGCl (Na+-free buffer) with and without serine (1 mM). All buffers contained TMR-dextran (100 μg/ml). The incubation was for 15 min at 37°C. The cells were then fixed with 4% paraformaldehyde for 5 min, washed with phosphate-buffered saline, and mounted using Prolong diamond with DAPI. The images of TMR-dextran uptake (red) and DAPI (blue) were taken using confocal microscopy with a 60X objective and analyzed using NIS software. The images represent a maximum projection intensity derived from a Z-stack. (B) Quantification of the fluorescence signals, measured as the corrected total cell fluorescence using Image J software. ANOVA followed by Dunn's test was used to determine the statistical significance among the groups. Data represent means ± S.E. *, P < 0.05. (C) Amino acid selectivity for the promotion of TMR-dextran uptake. Each amino acid was used at a concentration of 1 mM. Fluorescence signals were quantified and statistical significance analyzed as described above. *, P < 0.05; NS, not significant.

