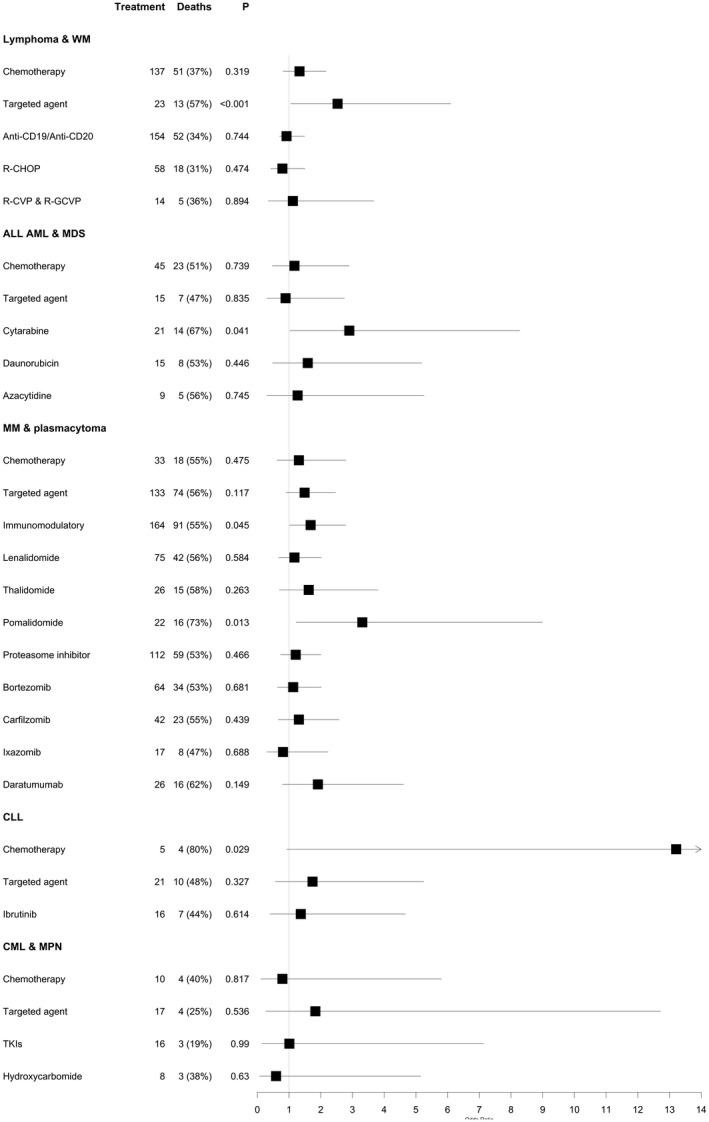
Fig 3.

The impact of specific cancer treatments split by haematological cancer subtype. The forest plots display the odds ratio and 95% confidence interval calculated using a multivariate model testing for the effect of each treatment in each haematological cancer subtype indicated. The following paitent numbers were available for analysis in each subgroup: lymphoma & WM: n = 330, ALL, AML & MDS: n = 91, MM & plasmacytoma: n = 273, CLL: n = 80, CML & MPN: n = 35. Tyrosine kinase inhibitors (TKIs) included bosutinib, imatinib, ruxolitinib, nilotinib and dasatinib. In the analysis of CML & MPN 8/10 chemotherapies are hydroxycarbamide and 16/17 targeted agents are TKIs. The odds ratio calculated when testing the impact of chemotherapy in CLL patients is 13·5 [95% confidence interval (CI) = 0·92–189·53]. This result, whilst suggesting a possible high‐risk of chemotherapy in this group of patients, is not reliable, being based on only five patients. This result needs validation in larger sample sets. The smaller numbers in these subgroup analyses mean only results of large effect sizes will be detected. ALL, acute lymphoblastic leukaemia; AML, acute myeloid leukaemia; CLL, chronic lymphocytic leukaemia; CML, chronic myeloid leukaemia; MDS, myelodysplastic syndrome; MM, multiple myeloma; MPN, myeloproliferative neoplasms; TKI, tyrosine kinase inhibitor; WM, Waldenström macroglobulinaemia.
