
FIGURE 1.
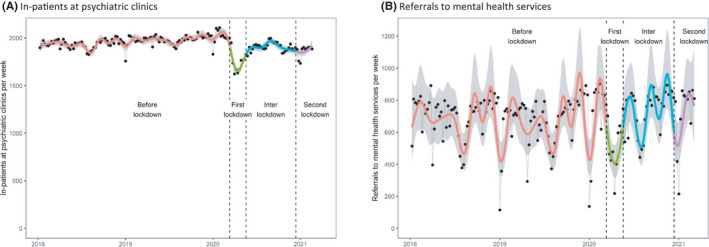
Trends in the number of in‐patients at psychiatric clinics and referrals to mental health services during COVID‐19. Black dots represent weekly numbers. Smoother curves are added using natural cubic splines. Grey areas represent 95% confidence intervals. (A) In‐patients at psychiatric clinics (B) Referrals to mental health services