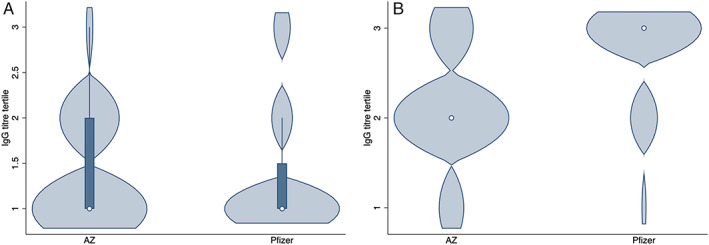
FIGURE 3.

Violin plot illustrating anti‐SARS‐CoV2 antibody response following complete COVID‐19 vaccine course, according to vaccine type. The plot shows distribution of results according to tertiles, using the “no DMT” group as a reference. The circle indicates median, and the bold line indicates interquartile range. Astra Zeneca: ChAdOx1 nCoV‐19 (Oxford–AstraZeneca), Pfizer: BNT162b2 mRNA (Pfizer‐BioNTech) vaccine. (a) People who had received anti‐CD20 monoclonal antibodies. (b) All other DMT (fingolimod excluded). COVID‐19 = coronavirus disease 2019; DMT = disease modifying therapy; nCov = novel coronavirus; SARS‐CoV‐2 = severe acute respiratory syndrome‐coronavirus 2. [Color figure can be viewed at www.annalsofneurology.org]
