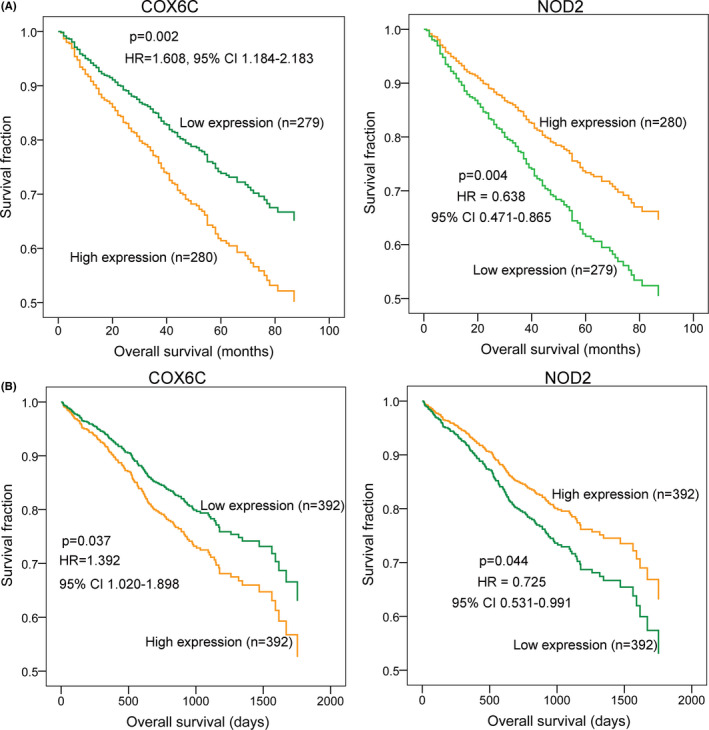
FIGURE 3.

Kaplan‐Meier survival analysis for COX6C and NOD2 in multiple myeloma. A, the overall survival analyses for the COX6C and NOD2 genes in the GSE24080 data set (n = 559). B, the overall survival analyses for the COX6C and NOD2 genes in The Cancer Genome Atlas (TCGA) cohort (MMRF‐CoMMpass, n = 784)
