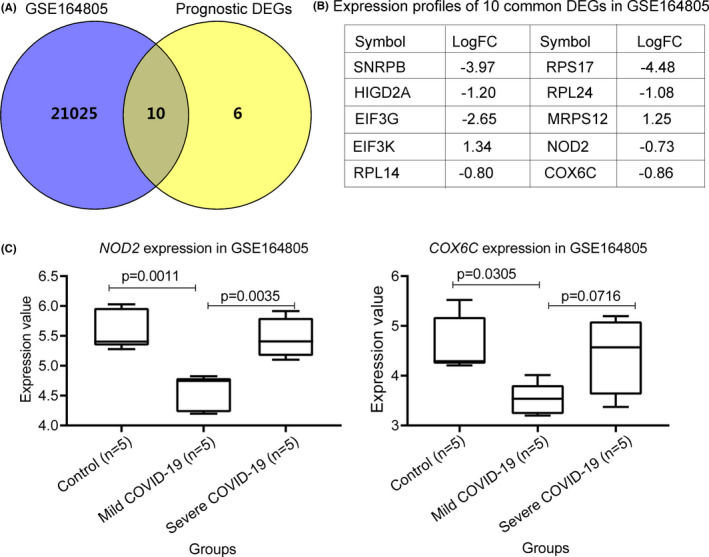
FIGURE 4.

Identification and expression of differentially expressed genes in patients with COVID‐19 infection and multiple myeloma. A, the Venn diagram indicating the common DEGs between patients with COVID‐19 infection and the 16 prognostic genes in multiple myeloma. B, the expression profiles of the 10 common genes in the GSE164805 data set. C, the expression profiles of the COX6C and NOD2 genes in the peripheral blood mononuclear cells (PBMCs) from patients with (mild = 5 and severe = 5) and without (controls) COVID‐19 infection
