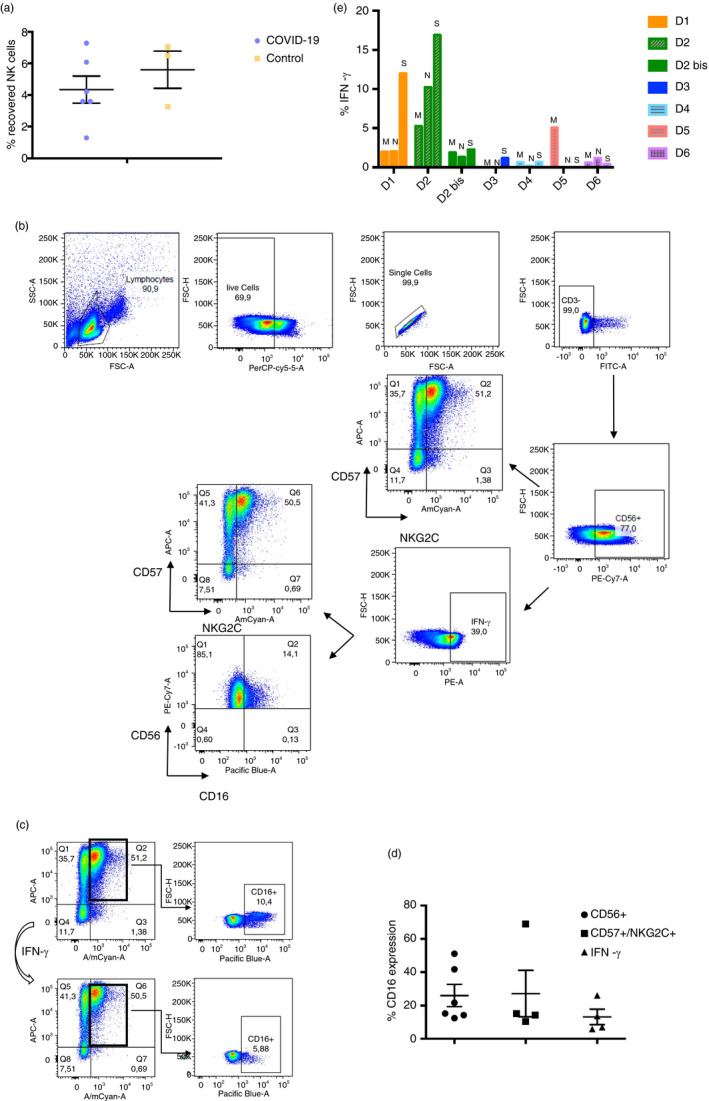
FIGURE 2.

Response of convalescent donor NK cells to SARS‐CoV‐2‐specific peptides measured by IFN‐γ production. (a) Percentage of NK cells recovered from PBMCs of blood samples, in purple from convalescent donors (n = 6), in yellow from healthy donors (n = 3). Each dot corresponds to an individual, and the mean with the standard error of the mean (SEM) is shown. (b) Representative figure of gating strategy of the different cell subsets within de CD3‐ CD56+ population (NK cells). On the right below, figure expression of IFN‐γ production by healthy donors’ NK cells. (c) Representative figure of CD16+ population analysis within the CD57+/NKG2C+ population (top), and the CD57+/NKG2C+/IFN‐γ+ population (bottom). (d) Percentage of CD16+ population expression within CD56+ subset, CD57+/NKG2C+ subset and IFN‐γ+ subset of convalescent donors. Each dot corresponds to an individual, and the mean with the standard error of the mean (SEM) is shown. (e) Percentage of IFN‐γ production done by convalescent donors’ NK cells in response to the presence of three different SARS‐CoV‐2 peptides (M, N and S)
