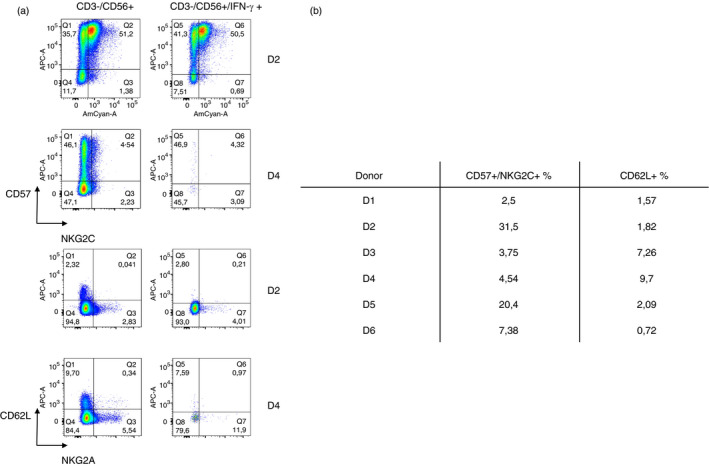
FIGURE 3.

Expression of the activated population CD57 + NKG2C+ and the naive NK cells population CD62L+ NKG2A+ in the convalescent donors. (a) Representative figure of the expression of CD57 + NKG2C+ and the naive NK cell population CD62L+ NKG2A+ of the best responder (D2) and the worst responder (D4). On the left column, these populations are contained within the CD3‐ CD56+ population, and on the right column, these populations are contained within the CD3‐ CD56+ IFN‐γ + population. (b) Table summarizing the percentage of CD57+ NKG2C+ and CD62L+ in each convalescent donor of IFN‐γ production assay
