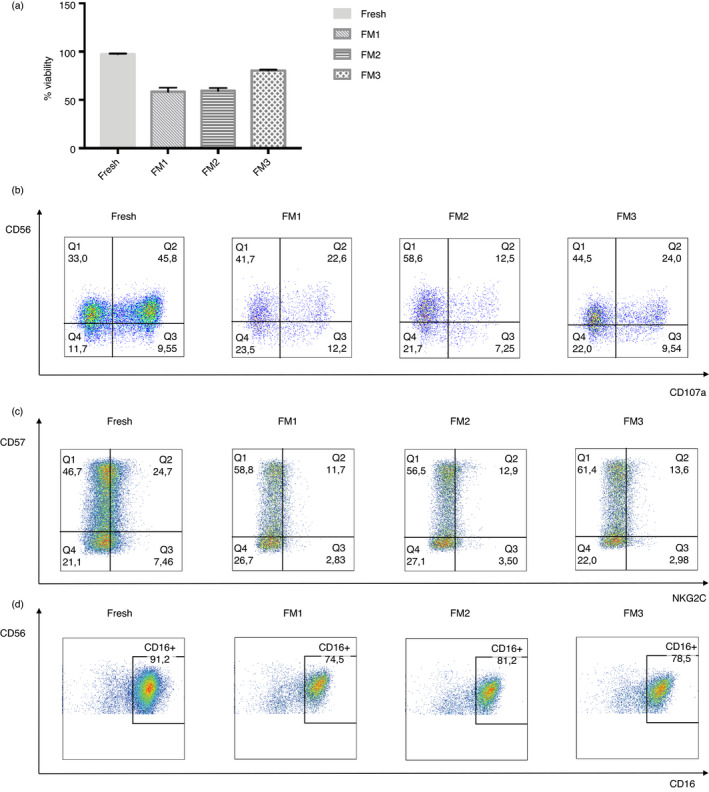
FIGURE 5.

Comparison of the condition of NK cells without freezing and after thawing with different freezing media (FM). (a) Viability of the NK cells in the fresh, FM1, FM2 and FM3 condition (n = 2). (b) Representative figure of the functionality measured by degranulation assay against K562 target cells in the four different conditions. (c) Representative figure of CD57+ NKG2C+ activated population expression on NK cells in the four different conditions. (d) Representative figure of CD16+ marker expression in the four different conditions. The bars represent the mean and error bars represent SEM
