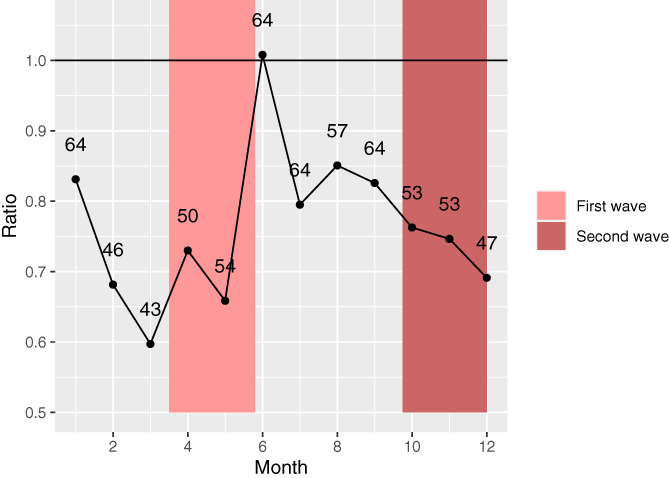
FIGURE 3.

Observed/expected ratio of registered advanced melanoma patients per month. The ratio was calculated as: (number of patients 2020)/(number of patients ([2018 + 2019])/2) per month. The number of observed newly diagnosed patients are presented in the graph as numbers [Color figure can be viewed at wileyonlinelibrary.com]
