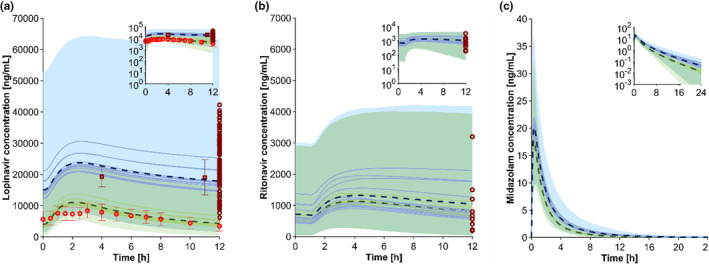
Figure 1.

Predicted vs. observed concentration‐time profile for lopinavir/ritonavir (a), ritonavir (b), and predicted concentration‐time profile for midazolam (c) in patients with coronarivus disease 2019 (COVID‐19; blue) and people living with HIV (PLWH) a, b or healthy volunteers c (green). The red and dark red marker show clinically observed data in PLWH 8 and patients with COVID‐19 7 , 29 (mean ± SD). The solid lines, the dashed lines, and the shaded area represents the mean of each simulation with a different IL‐6 concentration (1, 5, 10, 50, 100, 500, 1,000, 5,000, 10,000, and 50,000 pg/mL; Figure S2 ), the mean, and the 95% confidence interval of all simulated scenarios to recover all possible IL‐6 concentrations in the simulations. Overlapping confidence intervals between predicted PLWH and COVID‐19 concentrations are displayed in the blue‐green shaded area. [Colour figure can be viewed at wileyonlinelibrary.com]
