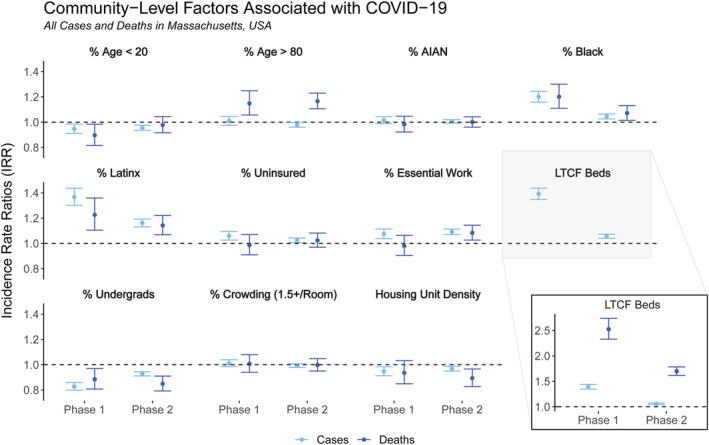
FIGURE 1.

Incidence rate ratios (IRR) for census tract‐level factors included in the regression models for total cases (lighter blue, on left) and total deaths (darker blue, on right) by phase of the pandemic in Massachusetts (Phase 1: March–June 2020, Phase 2: September 2020 to February 2021). Inset for LTCF Beds variable provided to show IRRs for deaths, which are outside the scale of the other variables
