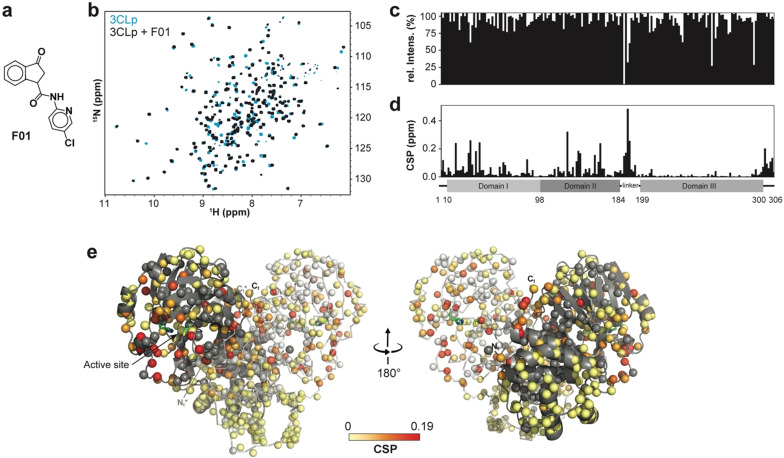
Figure 4.
Protein‐based NMR secondary screening. a) Fragment F01 structure. b) Overlay of two 2D 1H,15N‐TROSY‐HSQC spectra acquired on 3CLp in the absence (in light blue) and in the presence (in black) of fragment F01. The broadening of the resonances and 1H and 15N‐combined CSPs induced upon fragment binding are shown along the 3CLp sequence in (c) and (d), respectively. e) Structure of the 3CLp dimer (PDB: 7k3t), with protomers A and B shown in grey and white, respectively. Each small ball represents a proton amide and thus should correspond to a resonance in the 1H,15N 2D spectrum. The CSPs, shown in (d), have been color coded (from light yellow to red) and are displayed on these balls. Unassigned residues were kept in the original color of the protomer. Catalytic His41 and Cys145 are shown in green. See Scheme S2 and Table S2 for other hits. See the SI for a color‐blind‐friendly version of this Figure.

