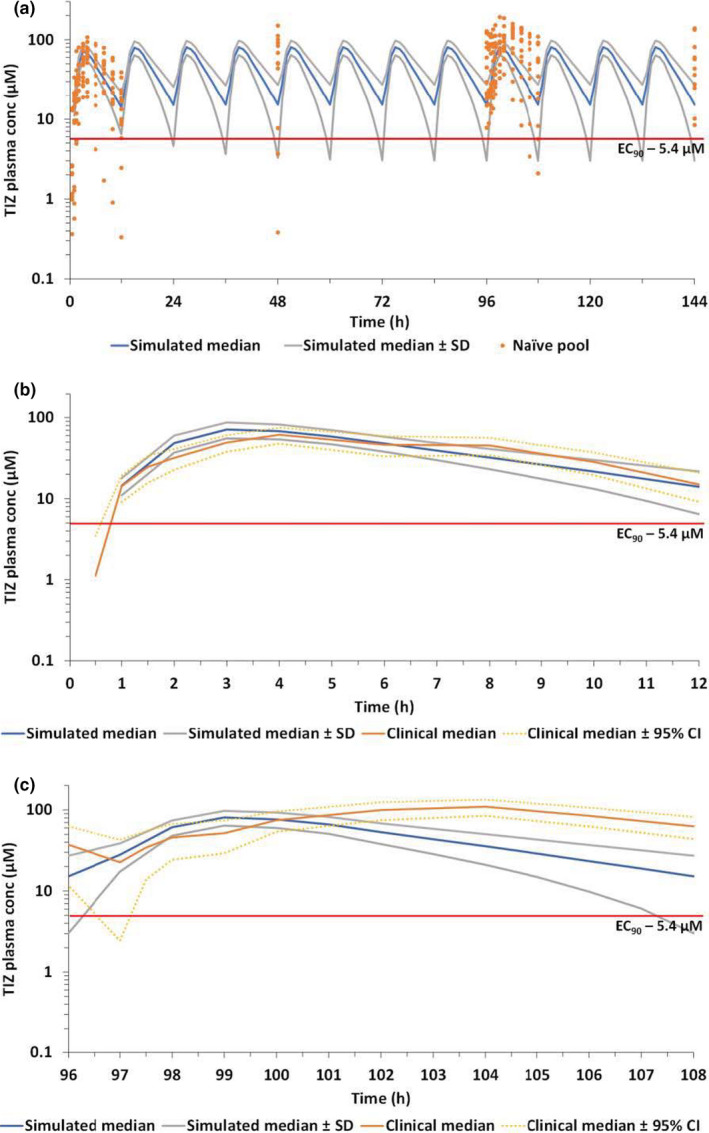
Figure 3.

Comparison of PBPK simulated and observed tizoxanide plasma concentrations. (a) comparison of median (SD) simulated concentrations (blue) against the naïve pool of plasma concentration in healthy individuals. (b) Comparison of observed and simulated median (95% CI) tizoxanide plasma concentrations following the first dose. (c) Comparison of observed and simulated median (95% CI) tizoxanide plasma concentrations on day 5. The red line represents the in vitro derived EC90 against SARS‐CoV‐2 (1.43 mg/L; 5.4 µm). CI, confidence interval; EC90, effective concentration 90%; PBPK, physiologically‐based pharmacokinetic; SARS‐CoV‐2, severe acute respiratory syndrome‐coronavirus 2; TIZ, tizoxanide. [Colour figure can be viewed at wileyonlinelibrary.com]
