
FIGURE 2.
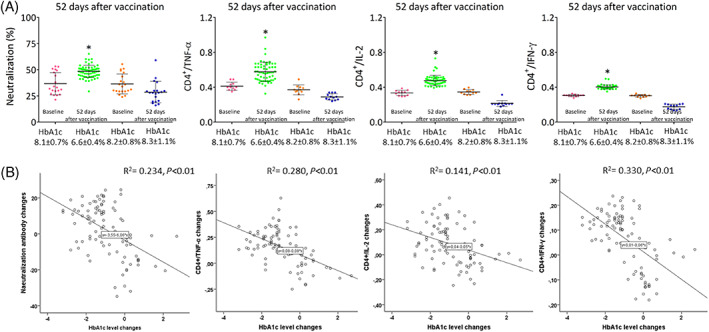
A, Neutralization antibodies and CD4+ T cells producing tumor necrosis factor‐α (TNF‐α), interleukin‐2 (IL‐2) and interferon‐γ (IFNγ) in type 2 diabetes (T2D) patients with poor glycaemic control at baseline (vaccination day) and with glycated haemoglobin (HbA1c) <7% (HbA1c 8.1 ± 0.7 to 6.6% ± 0.4%) and HbA1c >7% (HbA1c 8.2 ± 0.8 to 8.3% ± 1.1%) at follow‐up (52 days after the second vaccination dose). Boxplots show the median, 25th and 75th percentiles, range, and extreme values). *P < 0.05 vs. T2D patients with HbA1c <7% at follow‐up. B, Regression analysis of HbA1c level changes (vaccination day and 52 days after second vaccination dose) and CD4+ T‐cell response changes (21 and 52 days after the second vaccine dose)