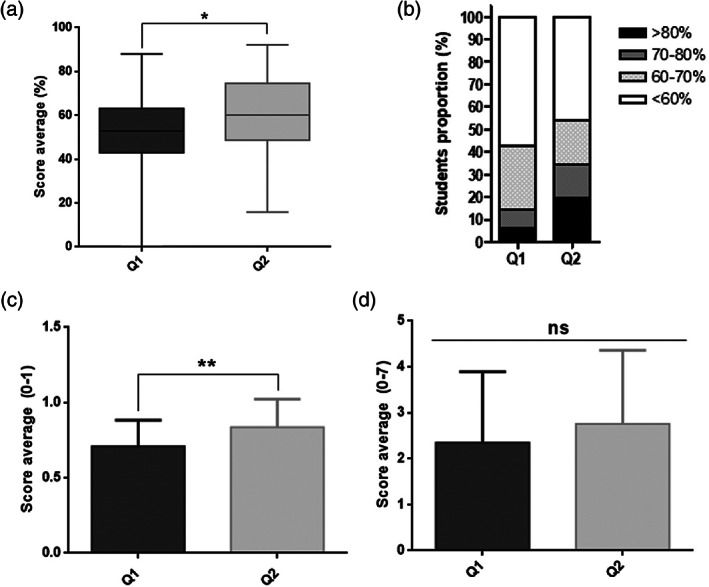
FIGURE 4.

Students showed a rapid evolution in their performance during the course. (a) General average score in each questionnaire (0%–100%); multiple‐choice and open‐ended questions represent 50% of the score each; (b) Proportion of students within score ranges in Q1 (n = 49) and Q2 (n = 26). (c) Students' scores average only in the multiple‐choice questions between questionnaires; (d) Students' scores average only in the open‐ended questions between questionnaires
