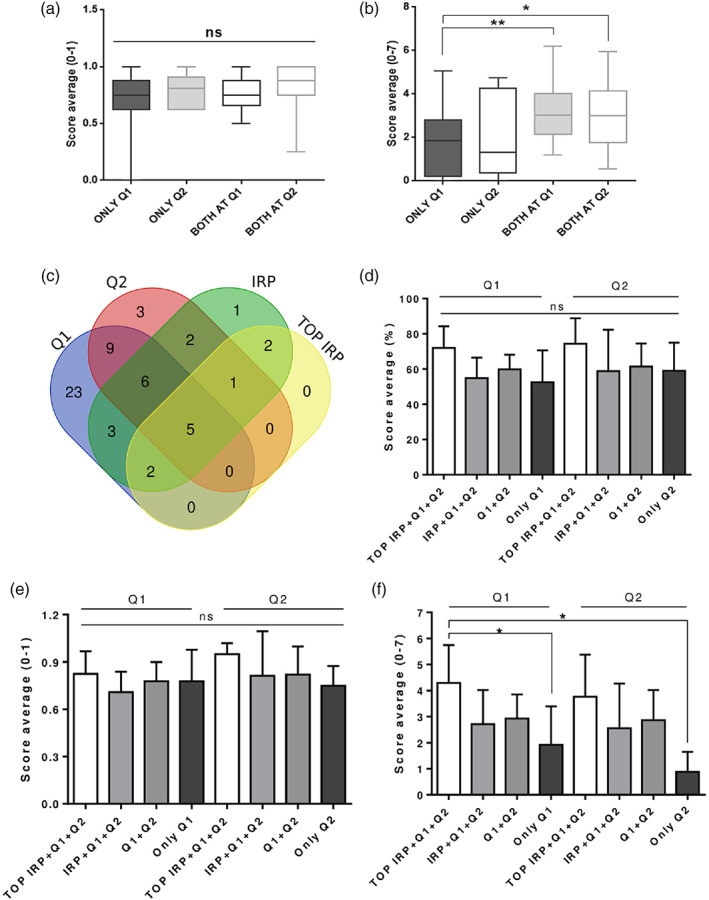
FIGURE 5.

Highly engaged students have better performances in open‐ended questions. (a) Students' scores average in the multiple‐choice questions within each engagement subgroup; (b) Students' scores in the open‐ended questions within each engagement subgroup. (c) Venn diagram, representing the number of participants in each activity (Q1, Q2, IRP, and TOP IRP). (d) Total score (%) in Q1 and Q2 analyzed in groups classified by the level of engagement in the course activities. The questionnaire to which the average scores refer is indicated by the horizontal bars (Q1 or Q2). (e) Students average in multiple‐choice questions within each group engagement. (f) Students average in open‐ended questions within each group engagement
