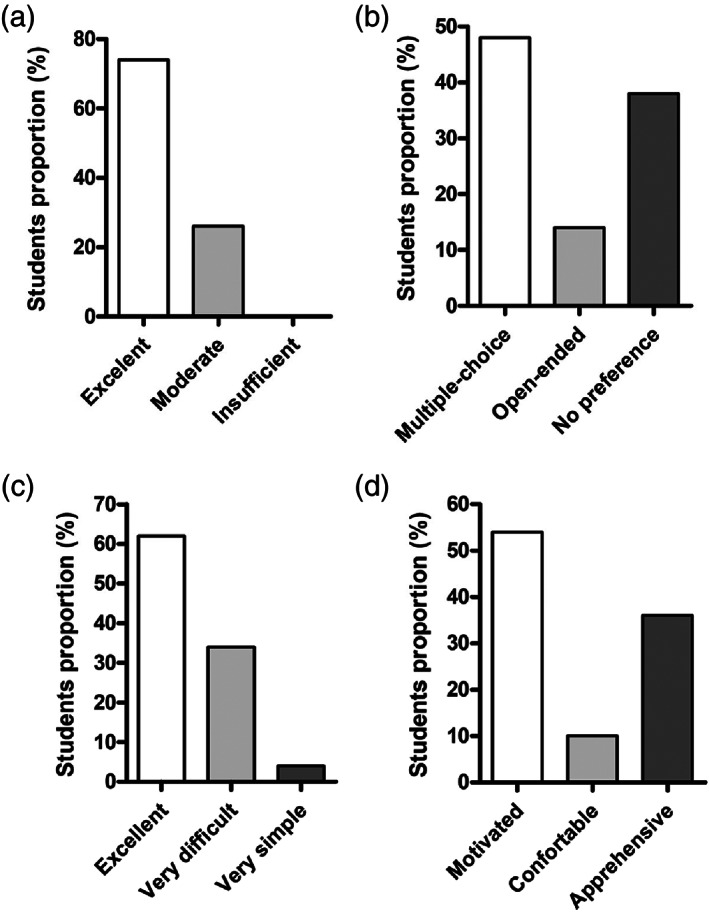
FIGURE 6.

Students demonstrate a positive feeling about active learning tool. (a) Percentage of responses from students on the multiple‐choice question “How do you think the course contributed to your learning?,” with possible answers “excellent,” “moderate,” and “insufficient.” (b) Percentage of responses to the multiple‐choice question “In the questionnaires, what type of question do you prefer?” with possible answers “multiple‐choice,” “open‐ended,” and “I have no preference.” (c) Percentage of students' responses to the question “How do you evaluate the problem‐based questions present in the questionnaires?” with possible answers “They were excellent,” “They were very difficult,” and “They were very simple.” (d) Percentage of responses to the question “How did you feel during the conduct of the inquiry research project?,” with possible responses being “motivated,” “comfortable,” and “apprehensive.” The percentage of responses was calculated on the number of students who answered the questionnaire (n = 50)
