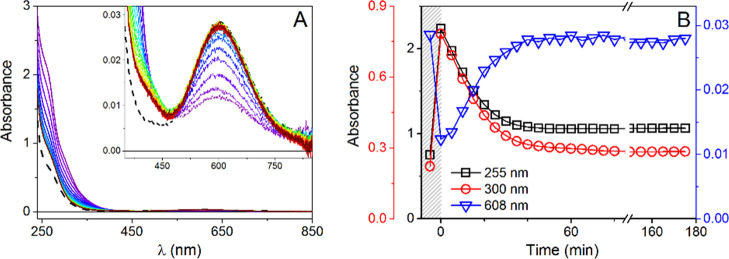
Figure 1.
(A) UV–vis spectra collected with 5 min intervals for 0.50 mM GHK with 0.45 mM Cu(II) in the presence of 1.0 mM GSH at pH = 7.4, T = 37 °C and (B) absorbance changes at 255 nm (black squares), 300 nm (red circles), and 606 nm (blue triangles), plotted as a function of time; absorbance values for the binary complex are presented in the shaded field; dashed line represents the spectrum of Cu(II)GHK.

