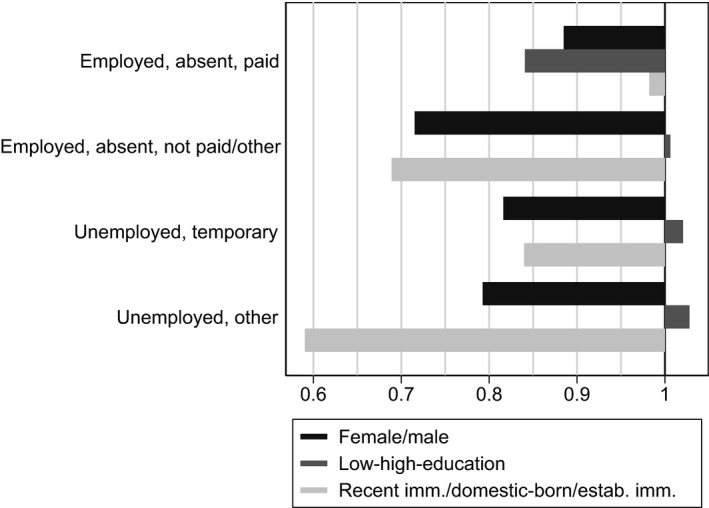
FIGURE 12.

Probability of employment in June by non‐work state in April, group ratios
NOTES: Ratios of proportions of people who were in each of the listed states in April 2020 and who were employed and at work in the LFS survey week in June 2020. Based on longitudinal LFS data.
