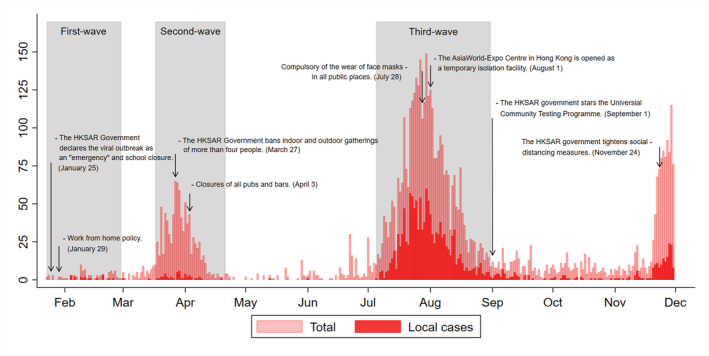
FIGURE 1.

Number of COVID‐19 cases by date of reporting and timelines of interventions in Hong Kong. The epidemic curve shows the reported cases and key interventions that have occurred to date from January 1 to November 30, 2020 (gray shading areas for the three waves of COVID‐19 pandemic). The first confirmed COVID‐19 case in Hong Kong was announced on January 23, 2020: first wave from January 23 to February 29; second wave from March 17 to April 21; third wave from July 5 to August 31, 2020. Y axis refers to numbers of confirmed cases. The definition of local cases according to whether the patient had a travel or residence history in other regions within 14 days before diagnosis and likely exposure to pathogens in those regions; the word “regions” here refers to areas outside of Hong Kong
