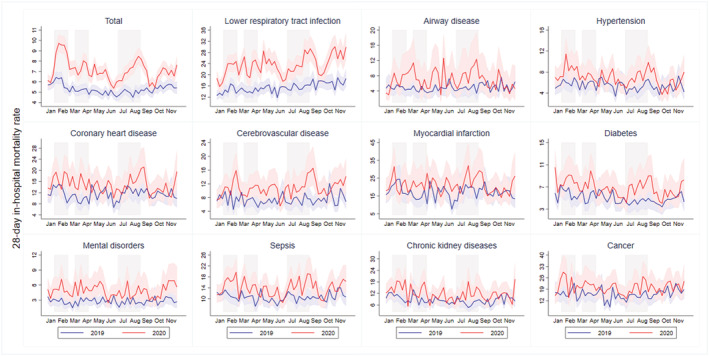
FIGURE 2.

Dynamic change in weekly risk of 28‐day in‐hospital death by diagnoses. The figure shows the actual weekly risk of 28‐day in‐hospital death by diagnoses from January 1 to November 30, 2020 (red line) and the same period in 2019 (blue line). 95% confidence intervals were calculated for weekly in‐hospital mortality rate by using a Poisson distribution (red shading area for 2019 and blue shading area for 2020). Three waves were shown in gray shading
