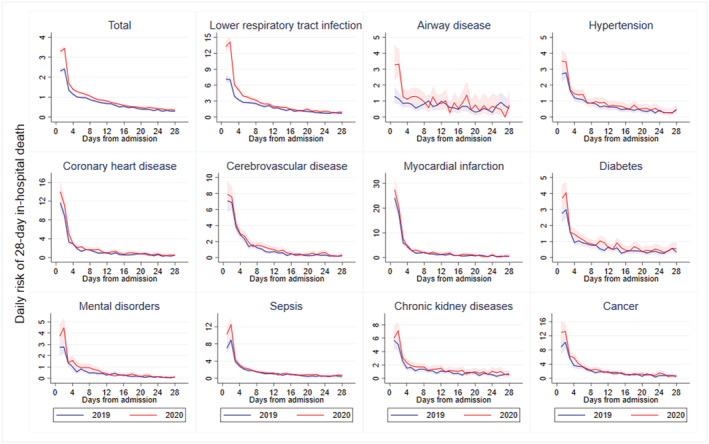
FIGURE 3.

Crude daily risk of in‐hospital death from emergency admission to 28 days by diagnoses in 2019 and 2020. The figure shows the actual daily risk of 28‐day in‐hospital death from January 1 to November 30, 2020 (red line) and the same period in 2019 (blue line); 95% confidence intervals are calculated for daily in‐hospital mortality rate by using a Poisson distribution (red shading area for 2019 and blue shading area for 2020). Patients who died on the day of hospital admission would have a follow‐up time equal to 0.5 day, assuming that death occurred in the middle of the day that death was registered
