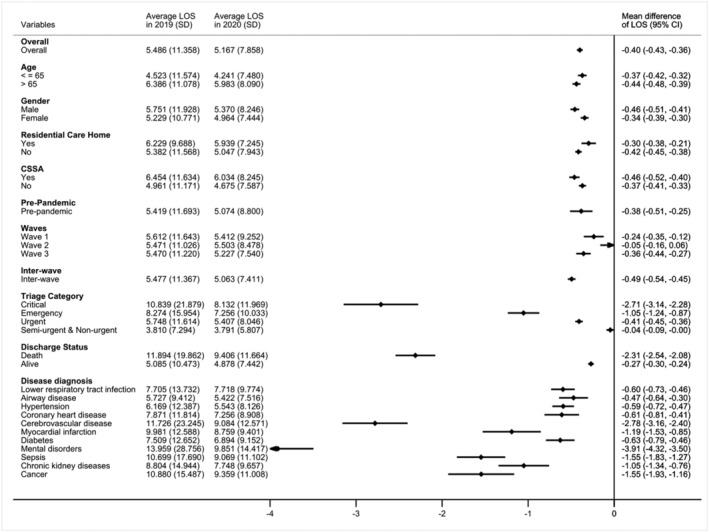
FIGURE 5.

Mean difference in length of stay (LOS) (with 95% confidence interval) of emergency admissions in 2020 compared with 2019. Mean difference in LOS were estimated using linear regression models adjusting for age, gender, race, region, living in residential care home for elderly, comprehensive social security assistance (CSSA), social deprivation index (SDI), arrive mode, time of attendance, triage category, total time spend in emergency department (ED), hospital size, and academic status. Average LOS and standard deviation of each year are shown in columns
