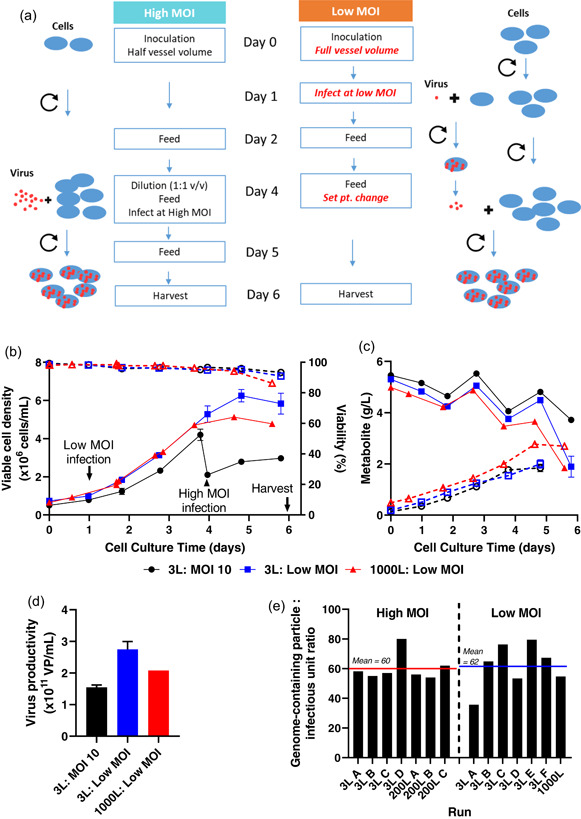
Figure 2.

Development of a low MOI upstream process. (a) compares, in schematic form, the original high MOI USP with the low MOI process developed for scale up. Red text indicates key changes in the low MOI process. (b)–(d) Results with the low MOI upstream process at 3 L (blue) and 1000 L (red) scale, as compared with the MOI = 10 process at 3 L (black). (b) Cell counts (solid lines, filled symbols) and viability (dashed lines, open symbols). (c) Glucose (solid lines, filled symbols) and lactate (dashed lines, open symbols). (d) Productivity. Where present, error bars indicate median and range of duplicate cultures at 3 L scale. Other data was obtained in singlicate. (e) Similar genome‐containing virus particle: infectious unit ratios from successive runs of the high and low MOI processes at a variety of scales. qPCR and infectivity assays were performed on crude viral harvest samples collected 6 days after infection of the culture. MOI, multiplicity of infection; qPCR, quantitative polymerase chain reaction; USP, upstream process
