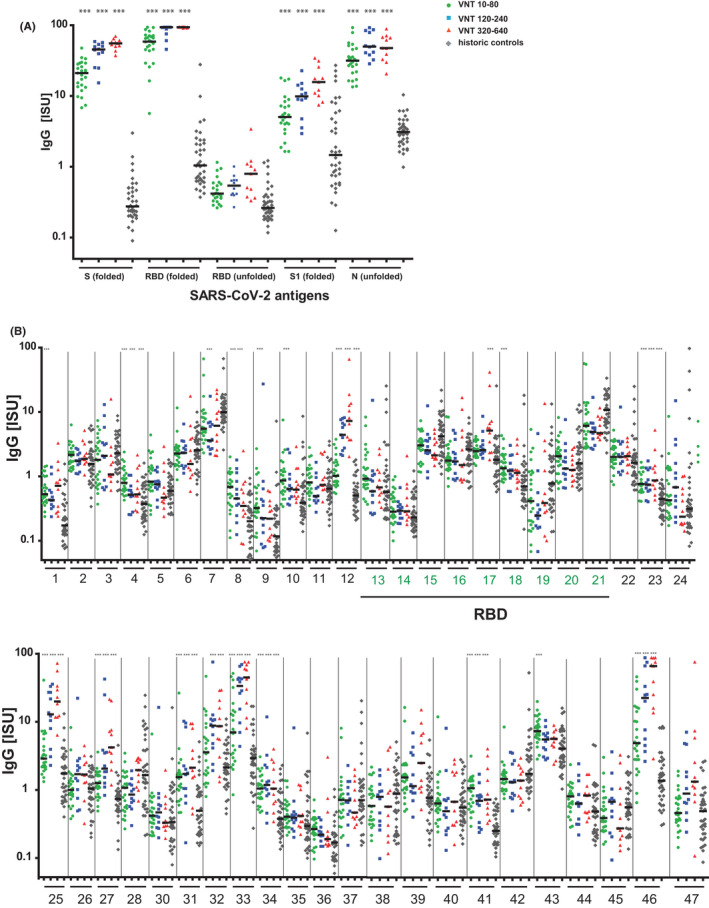
FIGURE 2.

IgG responses of convalescent COVID‐19 patients and historic controls to microarrayed SARS‐CoV‐2 proteins and peptides. (A) Protein‐ and (B) peptide‐specific IgG levels (x‐axes; proteins, peptides, RBD‐derived peptides green; y‐axes, ISU in log10 scale) in COVID‐19–convalescent patients according to their virus neutralization titers (VNT) and in historic controls. P values <.0001 for differences to historic controls are indicated as ***
