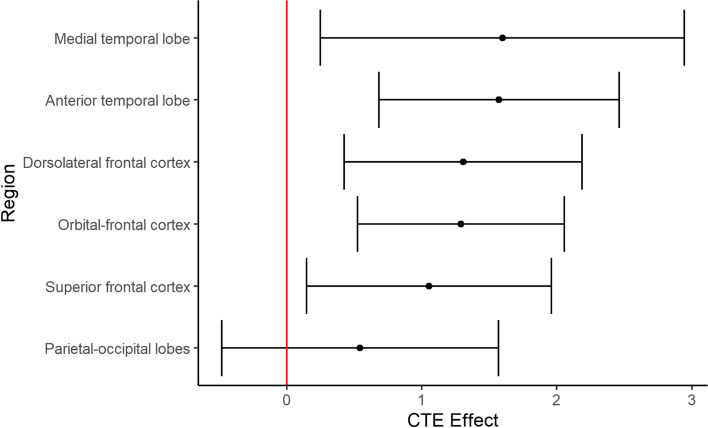
Fig. 2.
Visually rated MRI patterns of atrophy in CTE compared to participants with normal cognition. The regions (y-axis) were rated on a 5-point scale with 0 = none and 4 = severe and the left and right hemispheres were rated separately and combined into a summary composite for analyses (possible range: 0–8). The “Effect” represents the mean difference (black dot) between the brain donors with CTE compared to participants with normal cognition after accounting for age at the time of MRI. Higher x-axis scores represent higher scores (i.e., greater atrophy) in brain donors with CTE. The whiskers represent 95% confidence intervals. Statistically significant differences (i.e., false discovery rate-adjusted p-value less than 0.05) were found for the medial temporal lobe, anterior temporal lobe, dorsolateral frontal cortex, orbital-frontal cortex, and superior frontal cortex. There was no significant effect for the posterior-occipital lobes (p = 0.375).

