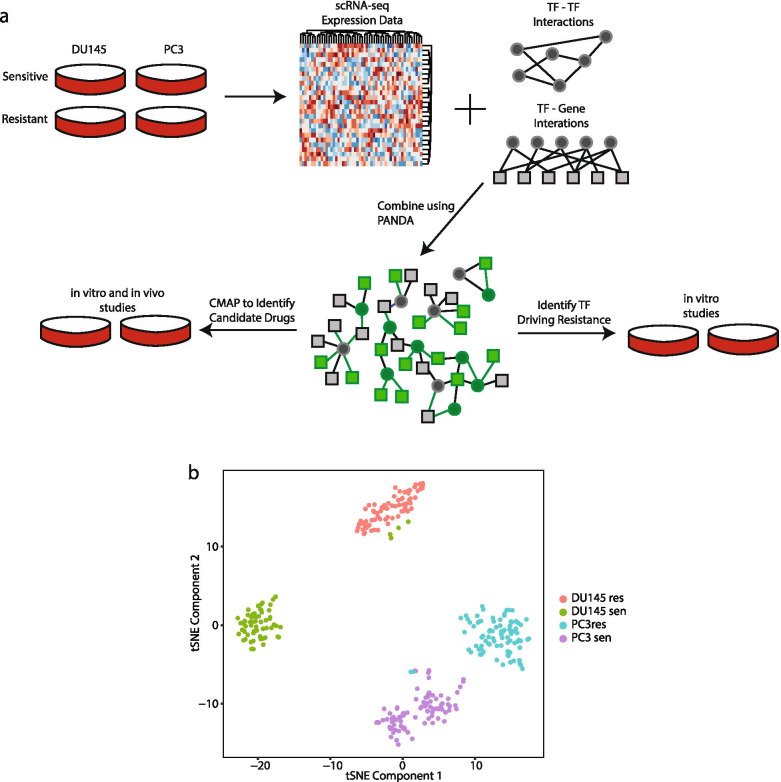
Fig. 1.
Detailed Workflow of Study. A Gene expression data from each scRNA-seq of each cell was combined with physical protein-protein interactions and predicted TF-gene targets to build individual network models. The models from each cell line were compared to identify differences. Shared differences between the DU145 models and PC3 models were combined to create a general model of docetaxel drug resistance. For representation: circles denote TF, squares denote a gene. In the combined network: grey denotes the node or edge is not significantly altered between the sensitive and resistant cells, a green edge or node is statistically significant. B tSNE of all single cells analyzed

