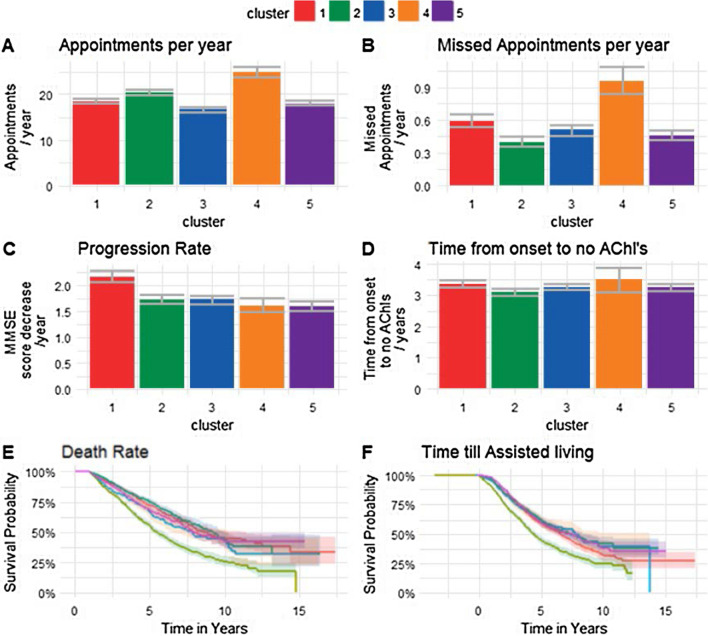
Fig. 2.
Outcomes of K-means clustering by cluster: A number of appointments per year post diagnosis with 5% confidence intervals, B number of missed appointments per year post diagnosis with 5% confidence intervals, C Progression rate based on decline in MMSE score per year with 5% confidence intervals, D time from onset of AD until AChls are stopped prescribed, with 5% confidence intervals, E Kaplan–Meier curve from diagnosis to death with log rank error, F Kaplan–Meier curve for time until the patient moves into assisted living with log rank error bars. AD Alzheimer's disease

