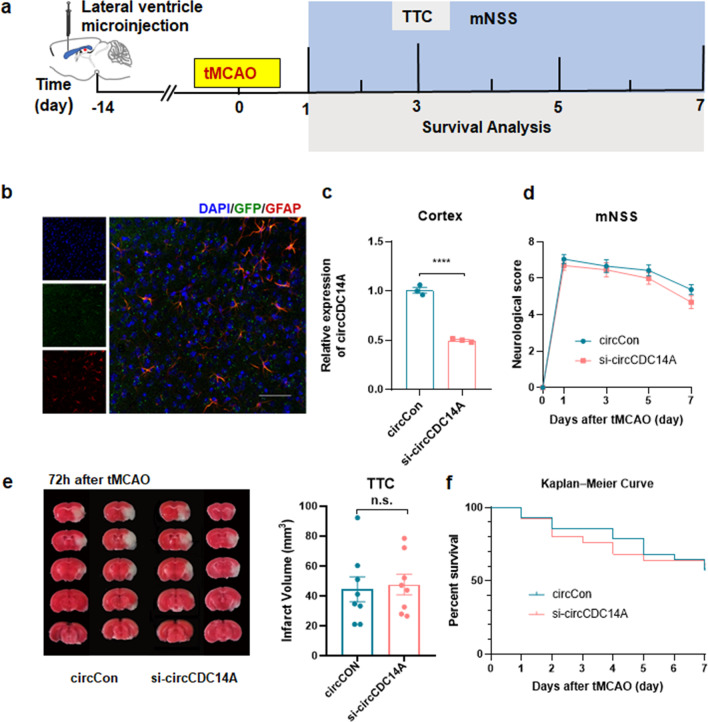
Fig. 5.
Knocking down the expression of circCDC14A in cortex. a Flow chart of the experiment design. b Colocalization of GFP lentivirus with GFAP 14 days after microinjection. Bar: 50 μm. c Expression of circCDC14A in cortex, n = 3 mice per group. ****P < 0.0001, Student’s t test. d Neurological deficit score of tMCAO mice in 1 day, 3 days, 5 days and 7 days after modeling. CircCon n = 18, si-circCDC14A n = 17. No significance, two-way ANOVA test. e Measurement of infarct volume by TTC staining 72 h after tMCAO, n = 8 mice per group. No significance, Student’s t test. f Kaplan–Meier curve of tMCAO mice in 7 days after modeling. CircCon n = 28, si-circCDC14A n = 25. No significance, log rank test

