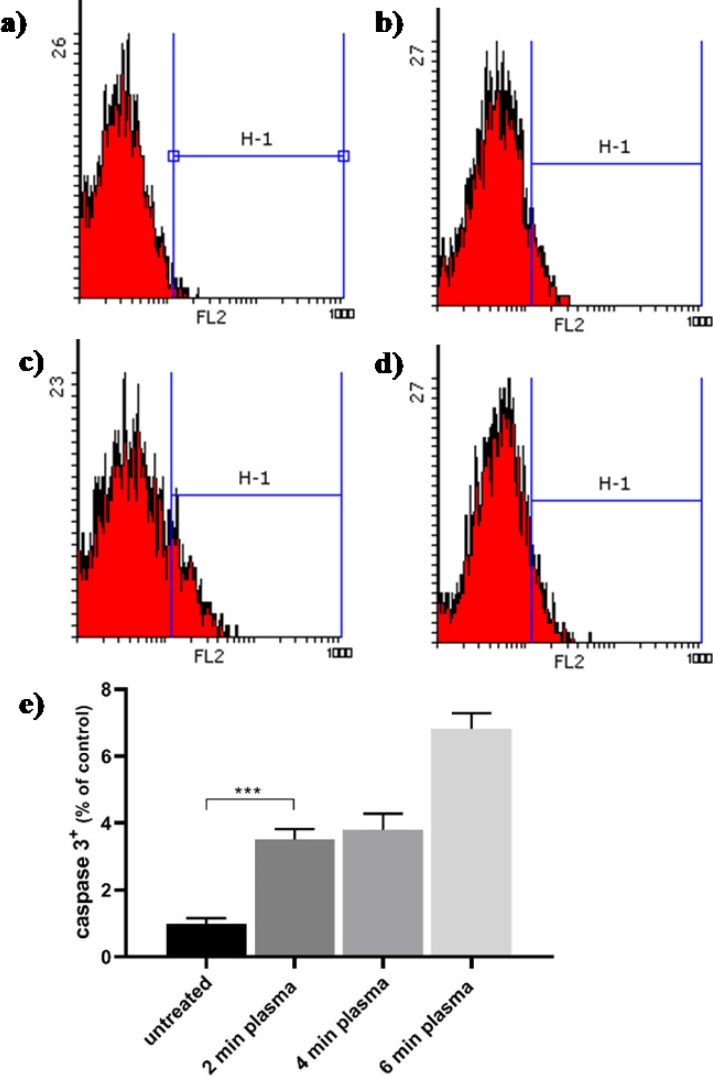
Figure 5.
Apoptosis of B 16 F 10 cancer cells treated by PAW. Caspase 3 histogram from flow cytometry of B 16 F 10 cancer cells after treated with (a) 0 min (b) 2 min, (c) 4 min, and (d) 6 min of PAW . (e) quantifying the caspase 3 + of melanoma cancer cells after 24 h. Data are normalized to the control group and presented as mean ± SD (n = 3). Statistical analysis was performed using one-way analysis of variances with p < 0.05 (*) and p < 0.001 (***); ns = non-significant

