Figure 5.
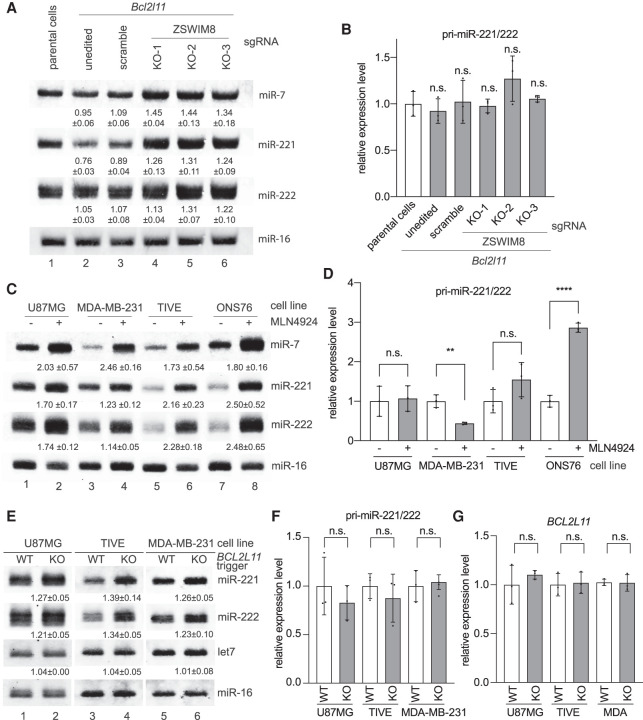
ZSWIM8 and the endogenous BCL2L11 TDMD trigger control miR-221/222 abundance. (A) The influence of ZSWIM8 on miR-221/222 accumulation in U87MG cells. Representative Northern blot measuring miR-7 (positive control), miR-221, miR-222, and miR-16 levels in U87MG cells stably expressing control or the Bcl2l11 trigger. In Bcl2l11 trigger cell lines, a scramble sgRNA, or one of the three sgRNAs (KO-1, KO-2, and KO-3) targeting ZSWIM8, was used for CRISPR-mediated KO. The normalized miRNA abundance and standard deviation are shown below each miRNA band. miRNA abundance was normalized to miR-16. The miRNA abundance in parental cells was normalized to 1. n = 3 biological replicates. (B) Primary transcripts for miR-221/222 measured by RT-qPCR in U87MG cell lines related to A, normalized to the levels of the ACTIN housekeeping gene. Error bars indicate SD. (n.s.) P > 0.05, unpaired Welch's t-test. n = 3 biological replicates. (C) The influence of neddylation inhibitor MLN4924 on miR-221/222 accumulation. Northern blot analysis of four cells (U87MG, MDA-MB-231, TIVE, and ONS76) following 48 h of 1 μM MLN4924 treatment. The normalized miRNA abundance and standard deviation are shown below each miRNA band. miRNA abundance was normalized to miR-16. The miRNA abundance in untreated cells was normalized to 1. n = 3 biological replicates. (D) Primary transcripts for the miR-221/222 measured by RT-qPCR in four cells (U87MG, MDA-MB-231, TIVE, and ONS76) related to C, normalized to the levels of the ACTIN housekeeping gene. Error bars indicate SD. (n.s.) P > 0.05, (**) P < 0.01, (****) P < 0.0001, unpaired Welch's t-test. n = 3 biological replicates. (E) The influence of the BCL2L11 TDMD trigger on miR-221/222 accumulation. Shown is a representative Northern blot measuring miR-221, miR-222, let-7, and miR-16 levels in three independently derived U87MG, TIVE, and MDA-MB-231 cell populations with or without BCL2L11 TDMD trigger KO. The normalized miRNA abundance and standard deviation are shown below each miRNA band. miRNA abundance was normalized to miR-16. The miRNA abundance in wild-type (WT) cells was normalized to 1. n = 3 biological replicates. (F,G) Primary transcripts for the miR-221/222 (F) and BCL2L11 (G) transcripts measured by RT-qPCR in three cell populations (U87MG, MDA-MB-231, and TIVE) related to E, normalized to the levels of the ACTIN housekeeping gene. Error bars indicate SD. (n.s.) P > 0.05, unpaired Welch's t-test. n = 3 biological replicates.

