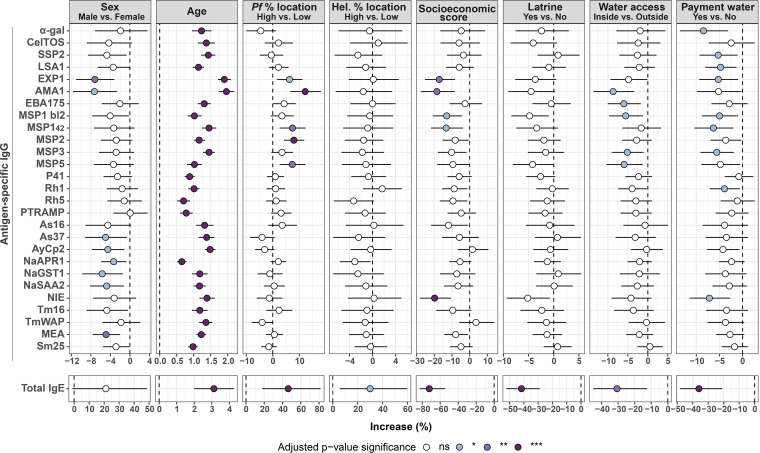
FIG 1.
Association of demographic, socioeconomic, water, and sanitation metrics with antibody levels in univariable linear regression models. Forest plots show the association of sex, age, percentage of P. falciparum-infected individuals by location, percentage of helminth-infected individuals by location, socioeconomic score, owning a latrine, piped water accessibility, and payment for water with specific IgG levels to P. falciparum and helminth antigens and total IgE levels. Univariable linear regression models were fitted to calculate the estimates (dots) and 95% confidence intervals (CI) (lines). The represented values are the transformed betas and CI showing the percentage increase for each 10% increase in the case of age (log-log model) or in comparison with the reference category for the rest of the variables (log-linear models) (see “Statistical analysis” section for more details). The color of the dots represents the P value significance after adjustment for multiple testing by Benjamini-Hochberg, where ns, not significant and *, P value ≤ 0.05; **, P value ≤ 0.01; ***, P value ≤ 0.001. Pf, P. falciparum; Hel., helminth.

