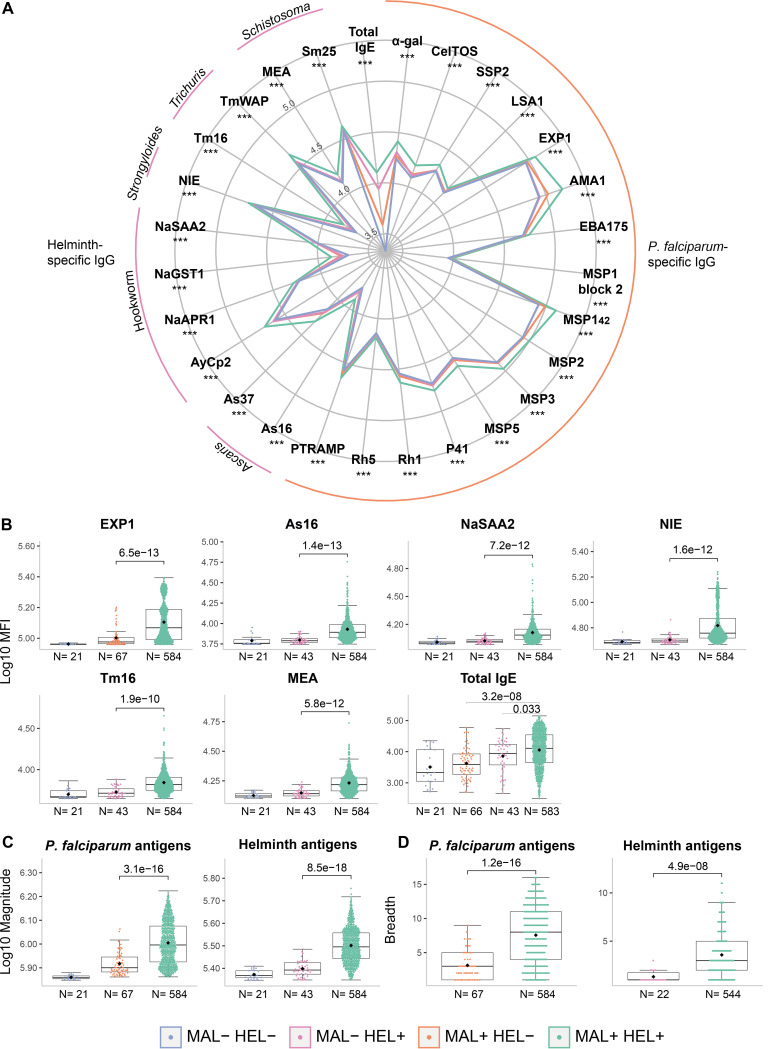
FIG 2.
Comparison of antibody responses between exposure/infection groups. (A) Radarplot summarizing the antibody responses per exposure/infection group. In the vertices, the antibody responses are grouped by specific IgG against Plasmodium falciparum antigens, helminth antigens, or total IgE. The colored lines represent the median of antibody levels expressed as log10-transformed median fluorescence levels (MFI). For P. falciparum and helminth antigen-specific IgG, the medians of the MAL+ HEL+ group were compared with the median of the MAL+ HEL− or MAL− HEL+ groups, respectively, by Wilcoxon rank-sum test. For total IgE, the median of the MAL+ HEL+, MAL+ HEL−, and MAL− HEL+ groups were compared by Kruskall-Wallis test. Statistically significant differences are indicated with asterisks (***, P ≤ 0.001). The boxplots compare infection groups based on (B) the log10-transformed MFI specific IgG levels against representative antigens per parasite species and total IgE, (C) the log10-transformed magnitude of response (sum of MFI), and (D) the breadth of response (number of seropositive antigen-specific IgG responses). The boxplots represent the median (bold line), the mean (black diamond), the first and third quartiles (box), and the largest and smallest values within 1.5 times the interquartile range (whiskers). Data beyond the end of the whiskers are outliers. Statistical comparison between groups was performed by Wilcoxon rank-sum test and the adjusted P values by the Benjamini-Hochberg approach are shown. Study groups are shown in colors, no exposure/infection (violet) (MAL− HEL−); only exposure/infection with helminths (pink) (MAL− HEL+); only exposure/infection with P. falciparum (orange) (MAL+ HEL−) and coexposure/coinfection with P. falciparum and helminths (green) (MAL+ HEL+). The rest of the antigens are shown in Fig. S9.

