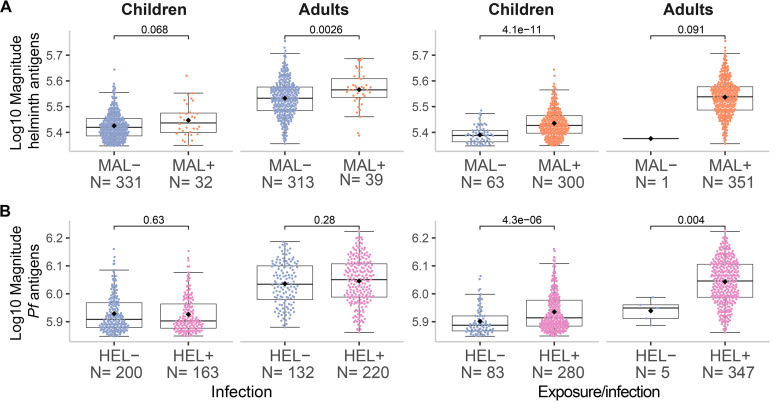
FIG 4.
Magnitude of response by infection or exposure/infection with malaria or helminths. The magnitude of response represents the sum of all specific IgG responses against (A) helminth or (B) P. falciparum antigens. The x-axis shows the classification of samples into negative (−) or positive (+) based on either past exposure and/or present infection (detected by serology and molecular and/or microscopic diagnosis) or present infection (detected by molecular and/or microscopic diagnosis) for (A) malaria (MAL) or (B) helminths (HEL). The boxplots represent the median (bold line), the mean (black diamond), the first and third quartiles (box) and the largest and smallest values within 1.5 times the interquartile range (whiskers). Data beyond the end of the whiskers are outliers. Statistical comparison between groups was performed by Wilcoxon rank-sum test and the exact P values are shown.

