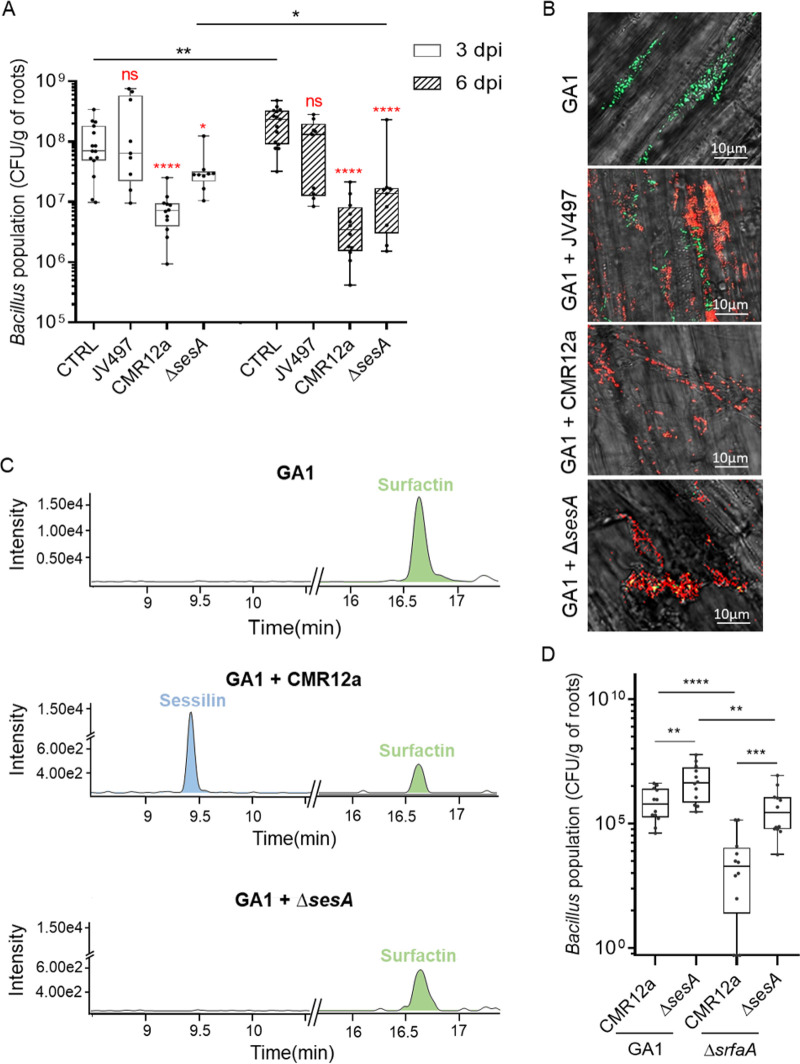
FIG 5.
Competitive root colonization assays support the roles of BSMs in Bacillus-Pseudomonas interaction in planta. (A) GA1 population (CFU per gram of tomato root) recovered at 3 days (empty bars) and 6 days (hatched bars) after coinoculation (dpi) with JV497, CMR12a, and its sessilin-repressed mutant compared to GA1 inoculated alone. Box plots were generated based on data from a minimum of three biologically independent assays each involving 6 plants per treatment (n = 18). The whiskers extend to the minimum and maximum values, and the midline indicates the median. Statistical differences between data at the same dpi are compared to the control (CTRL) and are labeled in red, while differences between treatments at different dpi are indicated with horizontal lines and a black asterisk when significant. Statistical analyses were performed using a Mann-Whitney test; ns, no significant difference; *, P < 0.05; **, P < 0.01; ****, P < 0.0001. (B) Confocal laser scanning microscopy images of tomato root colonization by GA1 (elongation root zone) at 6 dpi after monoinoculation (CTRL) or coinoculation with JV497, CMR12a, or CMR12a ΔsesA. GA1 tagged with GFPmut3 is depicted in green, while mCherry- or eforRed-labeled cells in red correspond to CMR12a and JV497 wild types or CMR12a ΔsesA, respectively. (C) UPLC-MS EIC illustrating relative production in planta of sessilin (blue peak) and surfactin (green peak) after 6 dpi of GA1 alone (GA1) or coinoculated with wild-type Pseudomonas (GA1 + CMR12a) or its sessilin-impaired mutant (GA1 + ΔsesA). (D) Cell populations recovered at 3 dpi for GA1 wild type (GA1) or the surfactin-impaired mutant (ΔsrfaA) coinoculated with CMR12a wild type (CMR12a) or its sessilin-impaired mutant (ΔsesA). Box plots were generated based on data from four biologically independent assays each involving at least 4 plants per treatment (n = 16). The whiskers extend to the minimum and maximum values, and the midline indicates the median. Statistical differences between the treatments were calculated using a Mann-Whitney test; **, P < 0.01; ***, P < 0.001; ****, P < 0.0001.

