
Fig. 1.
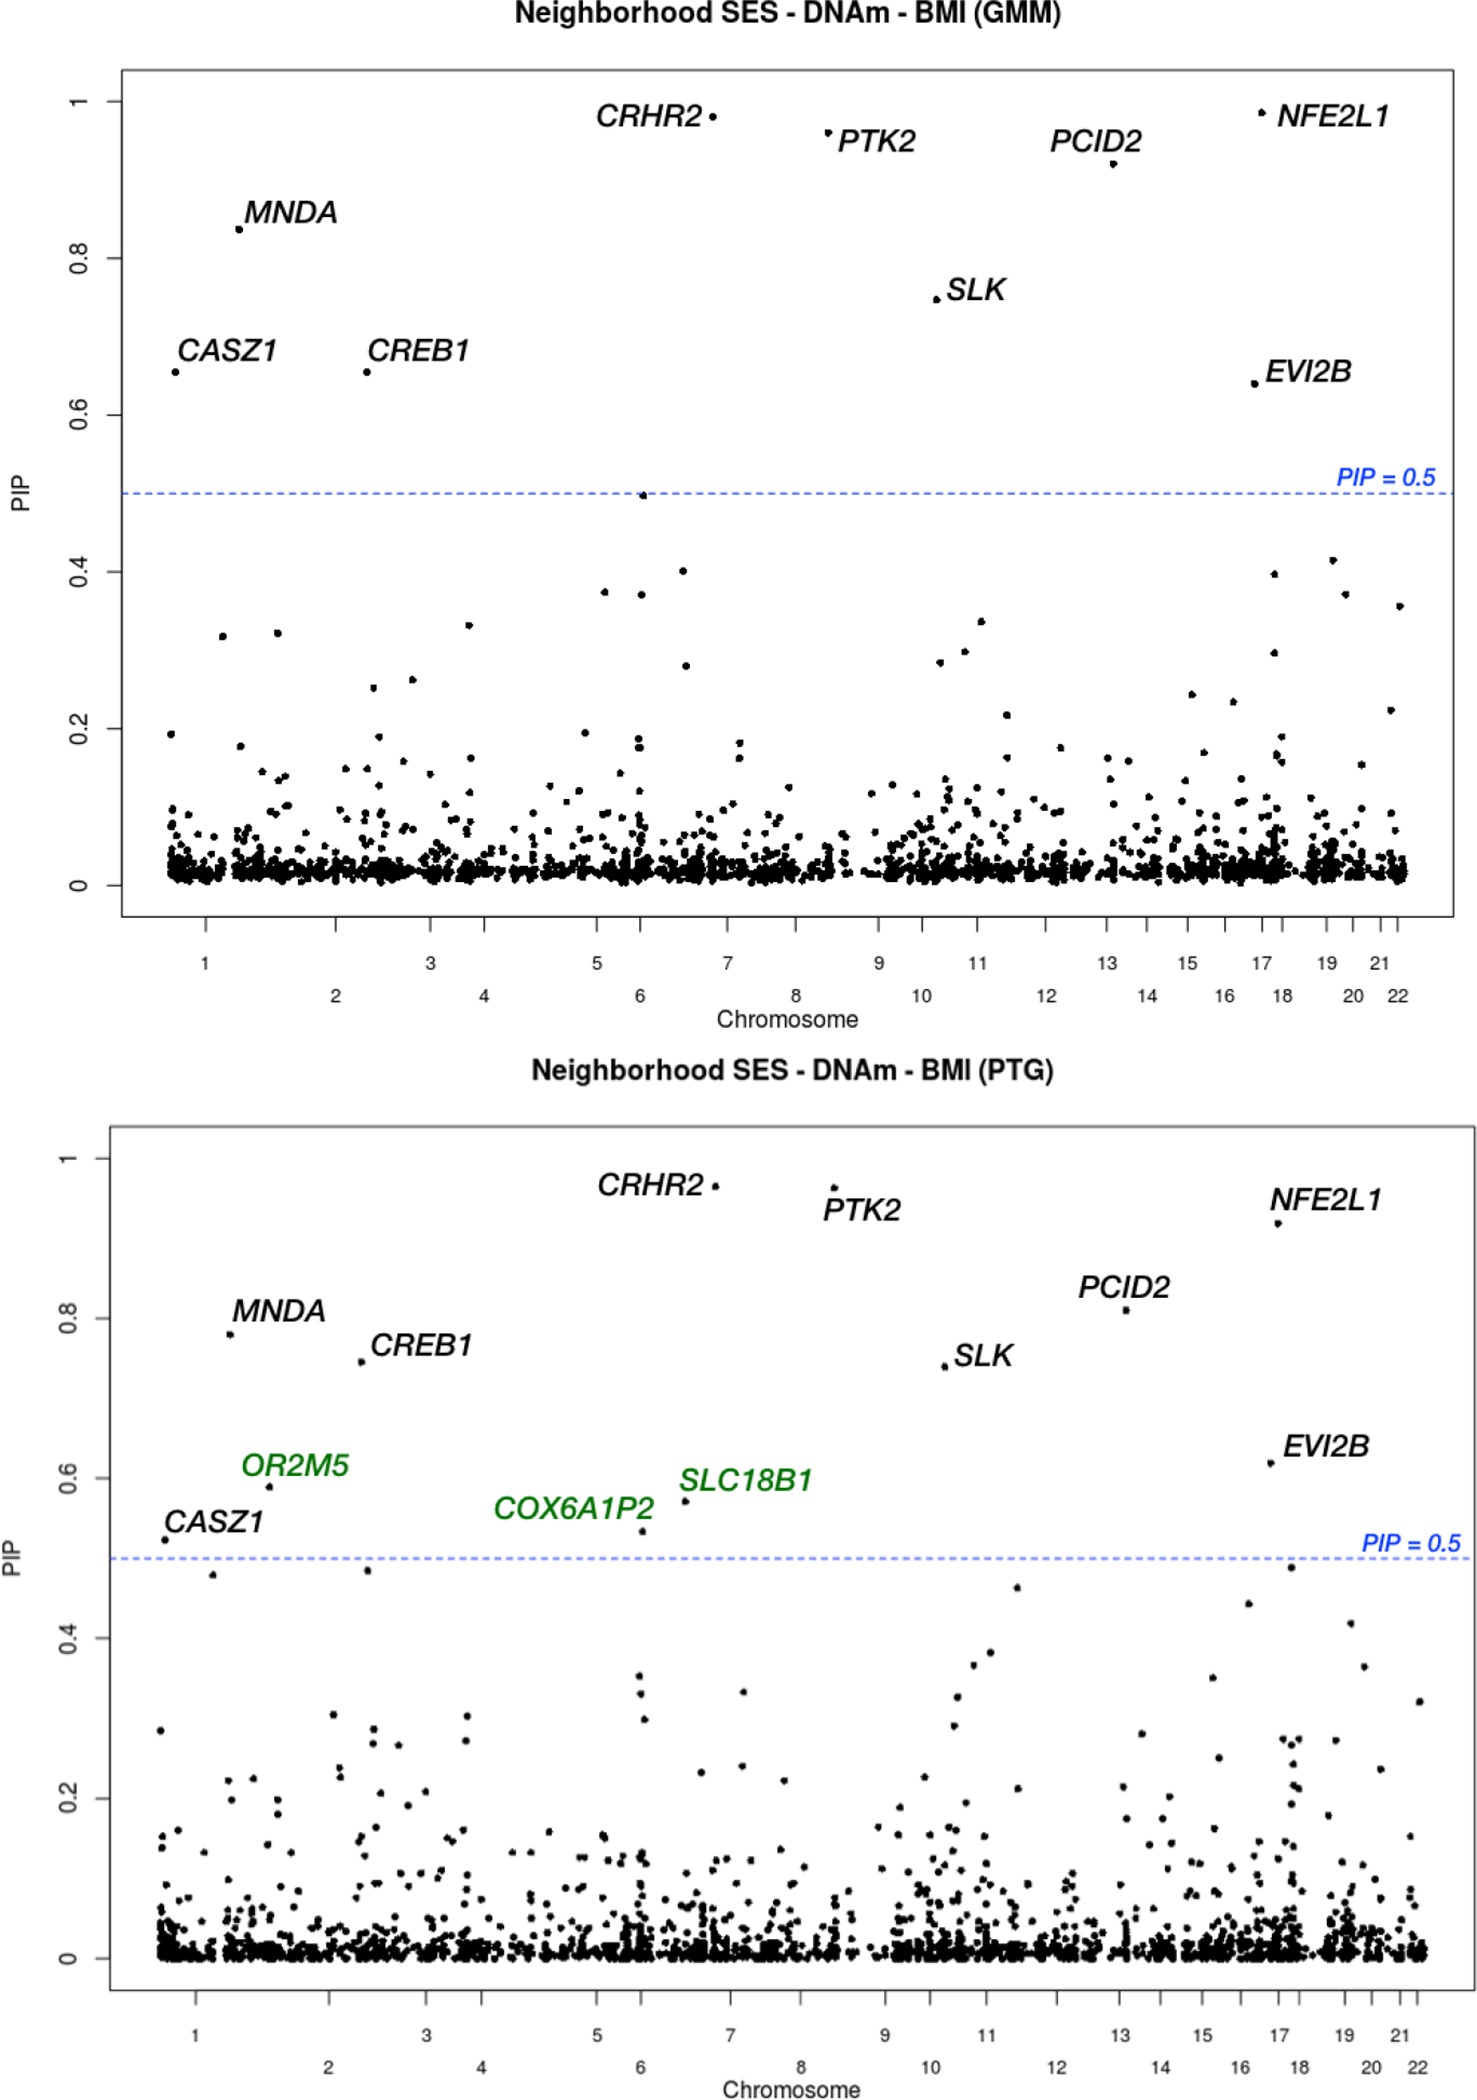
Data analysis results for the trio Neighborhood SES → DNAm → BMI in MESA data. The upper panel shows the PIPs obtained from the GMM method, and the lower panels shows the PIPs obtained from the PTG method. The blue lines mark the PIP = 0.5 threshold, and we include the nearby genes of the selected CpG sites. Most of the sites are identified by both methods, and the three genes in green are additional findings from PTG.