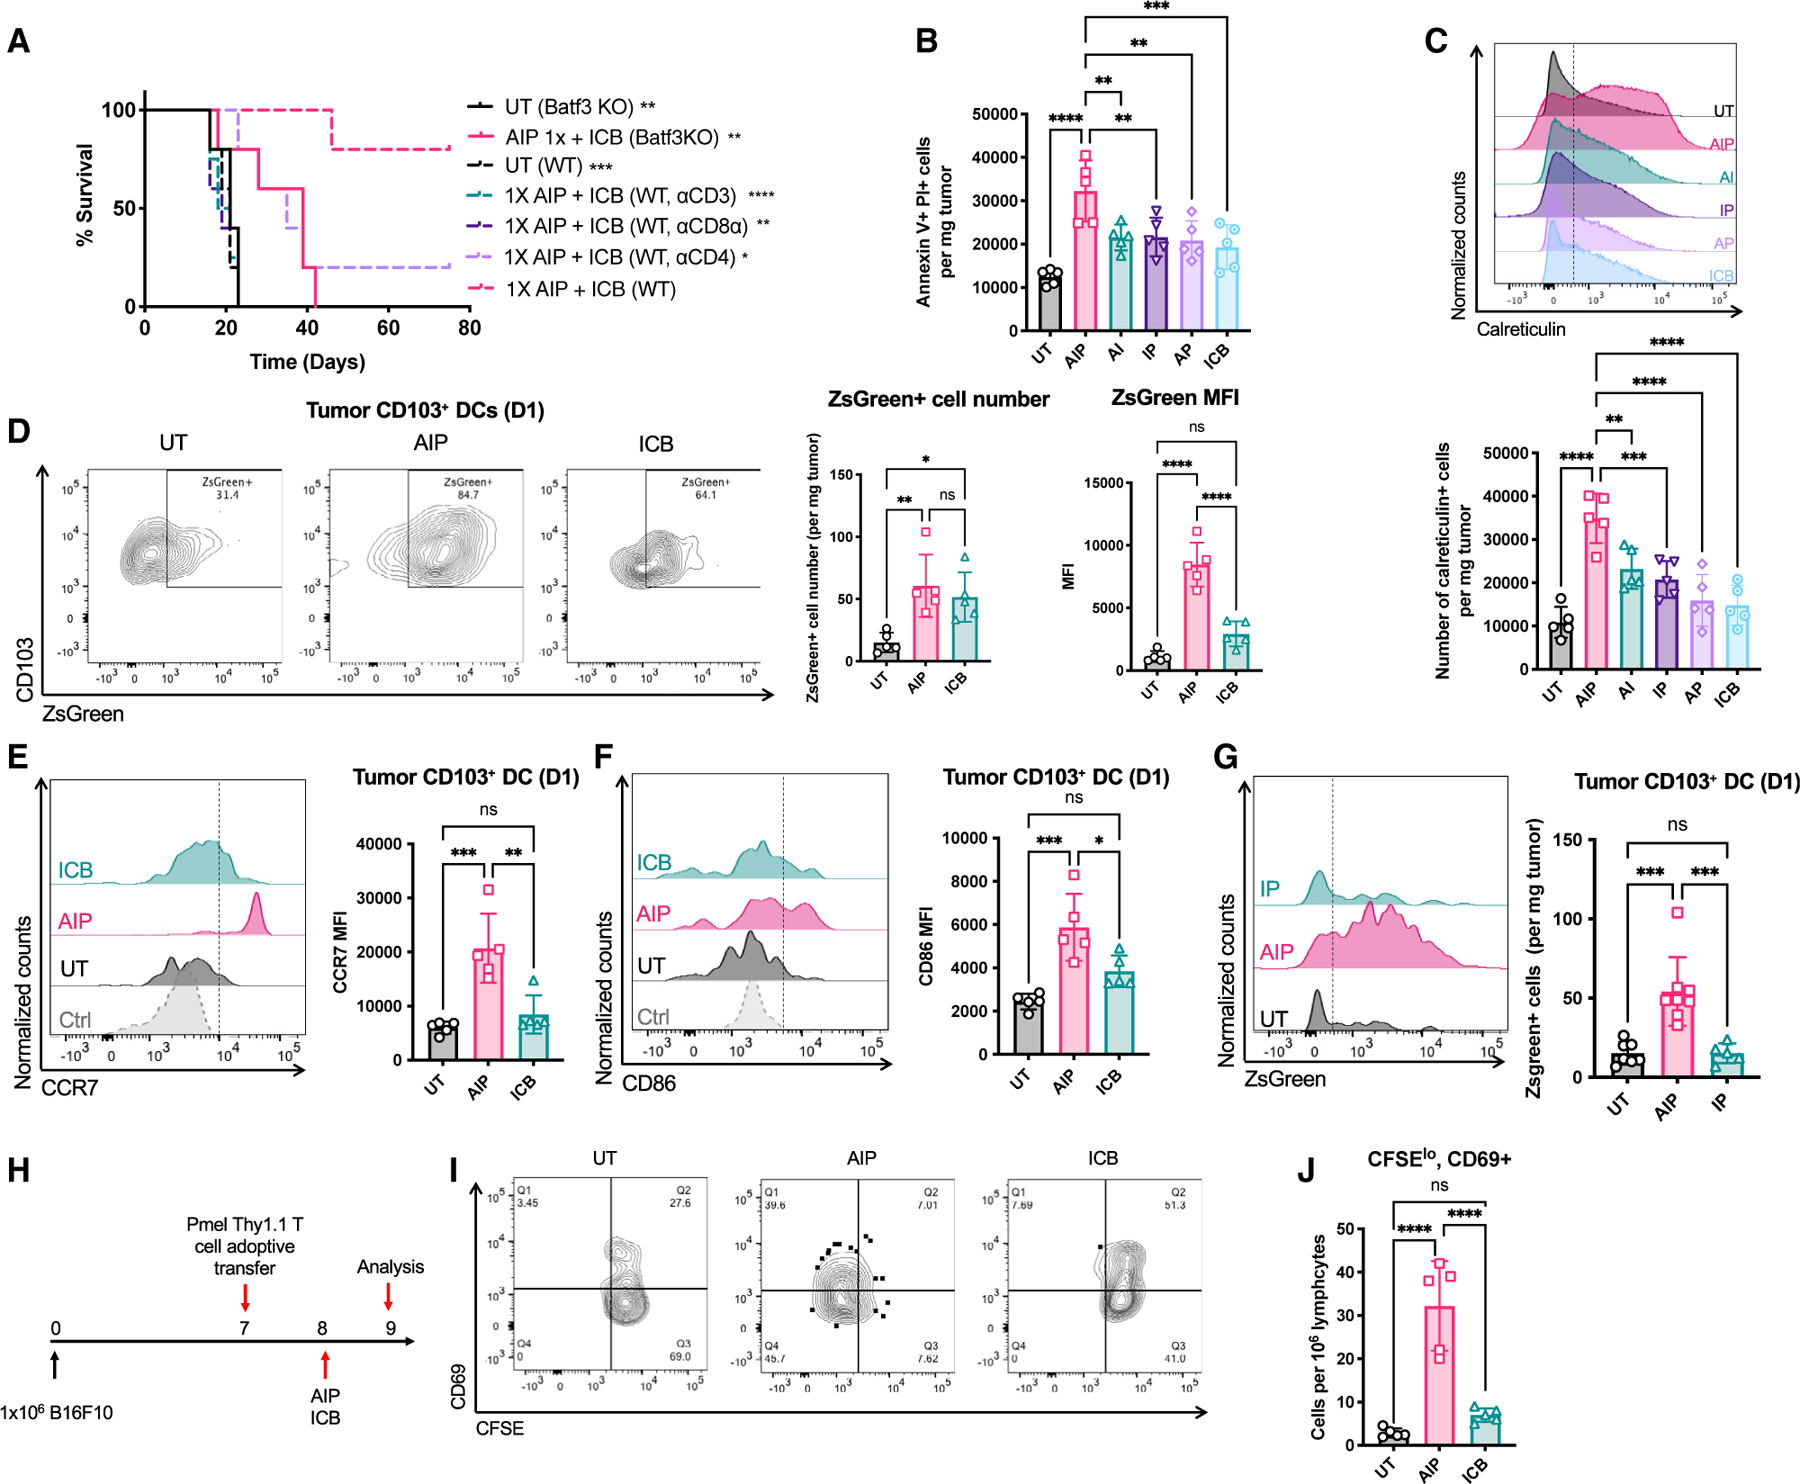
Figure 2. AIP immunotherapy activates antigen presentation in tumor-draining lymph nodes and promotes tumor-specific T cell activation.

(A) C57BL/6J mice bearing B16F10 tumors were left UT or treated with 1X AIP followed by ICB as in Figure 1G in the presence of depleting antibodies against CD3, CD8⍺, or CD4; shown is survival over time. Also shown is survival of tumor-bearing Batf3−/− mice left UT or treated with 1X AIP + ICB.
(B and C) C57BL/6J mice bearing B16F10 tumors were left UT or treated with 1X AIP followed by ICB as in Figure 1G.
(B) Quantification of apoptotic tumor cells at 1 day post treatment.
(C) Representative flow cytometry plots of cell surface calreticulin exposure on tumor cells 1 day post treatment.
(D–G) C57BL/6J mice bearing ZsGreen-B16F10 tumors were left UT or treated with 1X AIP followed by ICB as in Figure 1G.
(D) Quantification and representative flow cytometry plots of ZsGreen uptake by CD103+ DCs in tumors.
(E and F) Quantification of ZsGreen+CD103+ DCs in the tumor and the expression of CD86 and CCR7 by those cells.
(G) Quantification of ZsGreen+ CD103+ DCs in the tumor. Representative histogram plots of ZsGreen+ cDC1s in the tumor are also shown.
(H–J) C57BL/6J mice bearing B16F10 tumors were injected with CFSE-labeled pmel T cells 1 day prior to 1X AIP treatment followed by flow cytometry analysis of TDLNs 1 day later.
(H) Experiment timeline.
(I and J) Representative flow cytometry plots (I) and quantification of activated proliferating pmel T cells in tumors (J).
Throughout, n = 5 animals/group and shown are data from one representative of at least two independent experiments. *p < 0.05; **p < 0.01; ***p < 0.001; ****p <0.0001 versus AIP by log rank test in (A) and pairwise comparison by one-way ANOVA with the Tukey post test. All error bars are SD. See also Figure S3.
