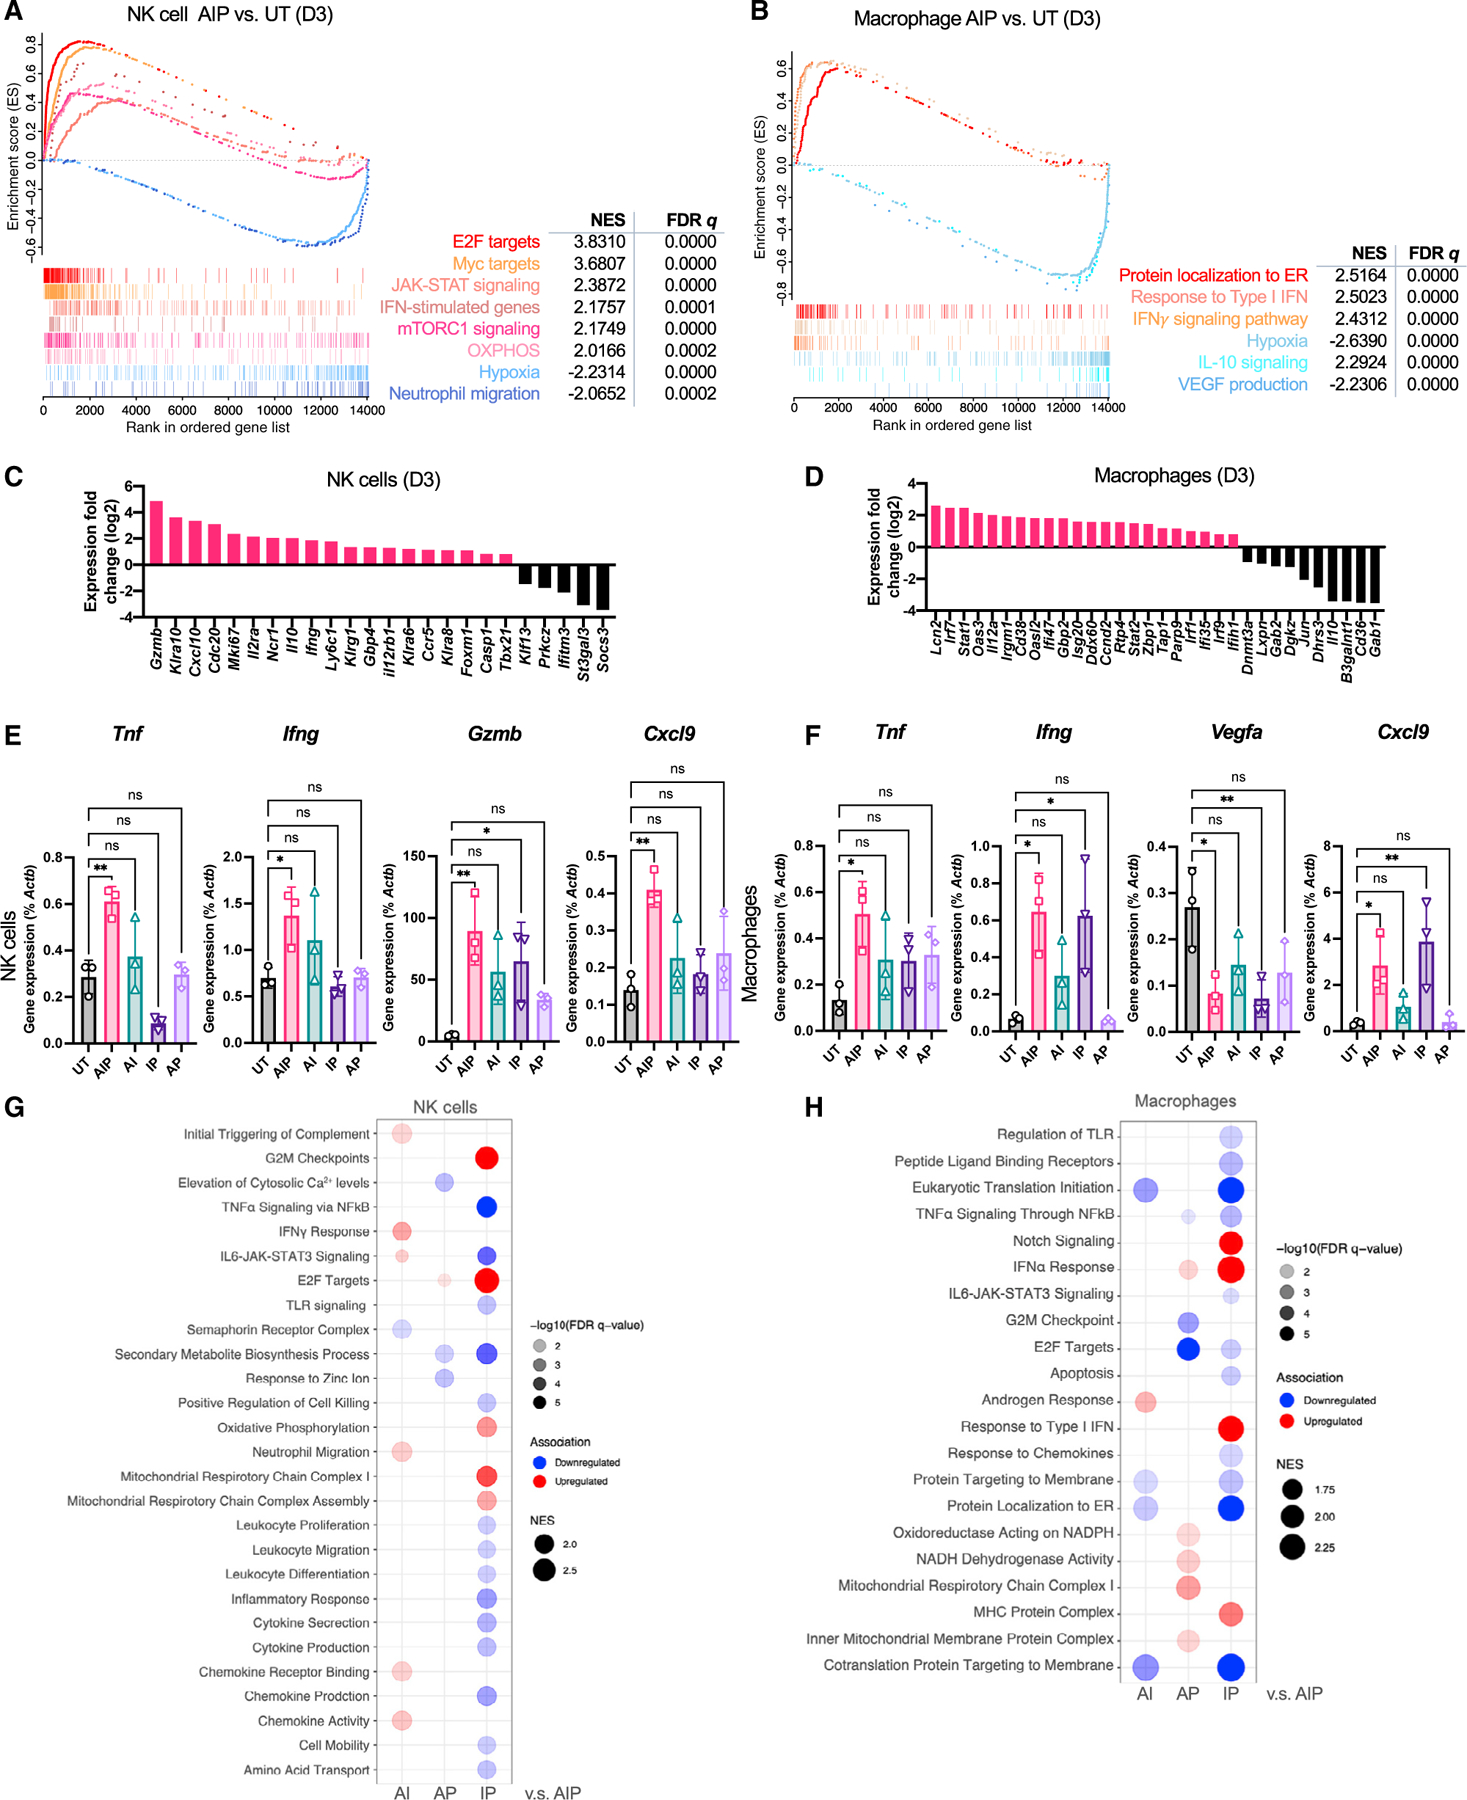
Figure 4. Intratumoral NK cells and macrophages are rapidly reprogrammed by AIP treatment.

Mice bearing B16F10 tumors (n = 3–5 animals/group) were left UT or treated with 1X AIP + ICB as in Figure 1G, followed by sorting of macrophages or NK cells and bulk RNA sequencing 3 days post treatment.
(A) Gene set enrichment analysis (GSEA) for NK cells in AIP versus UT tumors.
(B) GSEA for macrophages in AIP versus UT tumors.
(C and D) Expression of NK cell (C)-specific and macrophage (D)-specific genes related to their activation status and subtypes in tumor-infiltrating NK cells and macrophages isolated from AIP-treated or UT tumors 3 days post treatment.
(E and F) Expression of example genes as percentage of Actb from NK cell (E) and macrophage (F) samples determined by qPCR. *p < 0.05; **p < 0.01; ****p < 0.0001 versus UT by one-way ANOVA with Dunnett post test.
(G and H) GSEA of NK cells (G) and macrophages (H) across dual-combination treatment groups compared with those from AIP-treated mice. Red indicates upregulation and blue indicates downregulation. Circle size is proportional to NES, and color shade is proportional to false discovery rate q value as indicated (NES > 1.5 and q value < 0.01). All error bars are SD. See also Figure S4.
