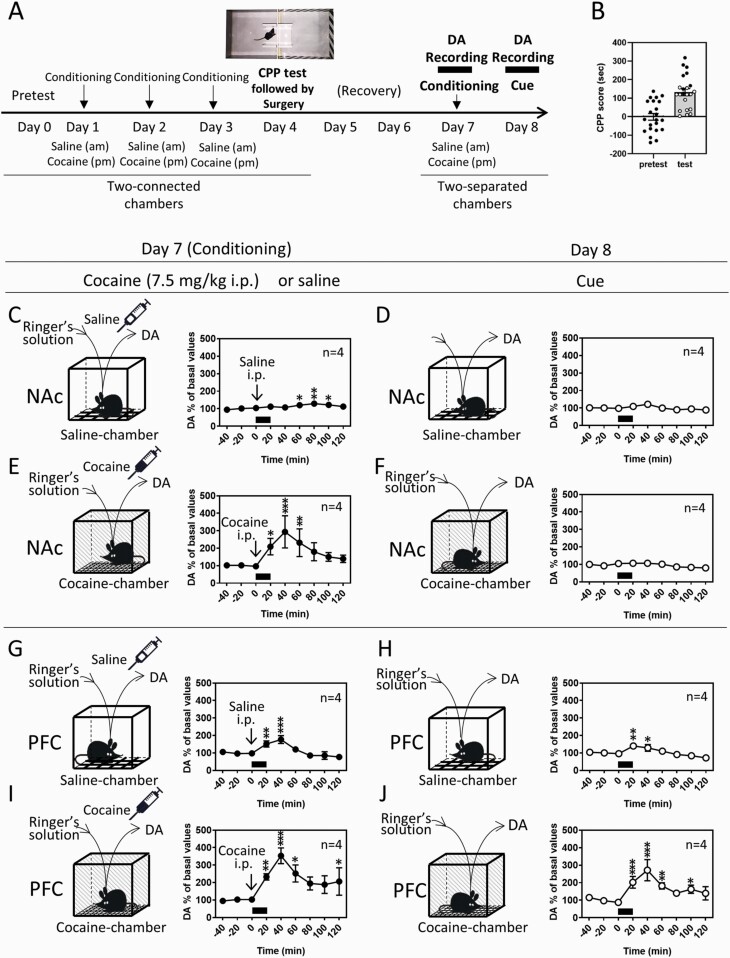
Figure 1.
Dopamine (DA) responses to saline and cocaine injections in additional place conditioning (day 7) and to saline- and cocaine-associated cues (day 8) in the nucleus accumbens (NAc) and prefrontal cortex (PFC). (A) Protocols for the conditioned place preference (CPP) to cocaine and subsequent measurements of DA. Following the pretest of chamber preference (day 0), saline and cocaine (7.5 mg/kg i.p.) were injected daily, and mice were placed in saline- and cocaine-paired chambers, respectively, for cocaine conditioning for 3 days (day 1–3) using the 2-connected chamber apparatus with a shielding plate between chambers. CPP was tested on day 4 using the 2-connected chamber apparatus without a shielding plate between chambers, and only the mice showing a preference for the cocaine-associated chamber were used for the following analyses. Additional cocaine conditioning for the developed CPP to cocaine was conducted on day 7 using the 2-separated chamber apparatus consisting of saline and cocaine chambers. The extracellular DA level was recorded from 2 to 3 hours before saline conditioning until 2 hours after the cocaine conditioning. Mice were kept in their home cage throughout the dopamine recording except for when they were placed in the saline or cocaine chamber for 20 minutes, where mice received injections. The saline or cocaine chamber has the same contexts as each paired chamber used for conditioning. On day 8, extracellular DA was subsequently recorded when mice were exposed to the saline or cocaine chambers without injections for 20 minutes, which was considered a cue. (B) CPP scores recorded on day 0 and day 4. CPP scores on day 4 of the mice used and unused for microdialysis experiments were shown as closed and open circles, respectively. (C–J) Extracellular levels of DA were measured in the NAc (C–F) and PFC (G–J) using in vivo microdialysis. Effects of the injections of saline (C, G) and cocaine (7.5 mg/kg, i.p.) (E, I) for additional cocaine conditioning (day 7) and the saline (D, H)- and cocaine (F, J)-associated cues (day 8) on DA levels were determined. Exposure of mice to the cues is indicated with black bars. Data represent mean ± SEM. The number of mice is indicated in each graph. *P < .05, **P < .01, ***P < .001 vs the basal levels of DA; mixed linear models.

