
Figure 1.
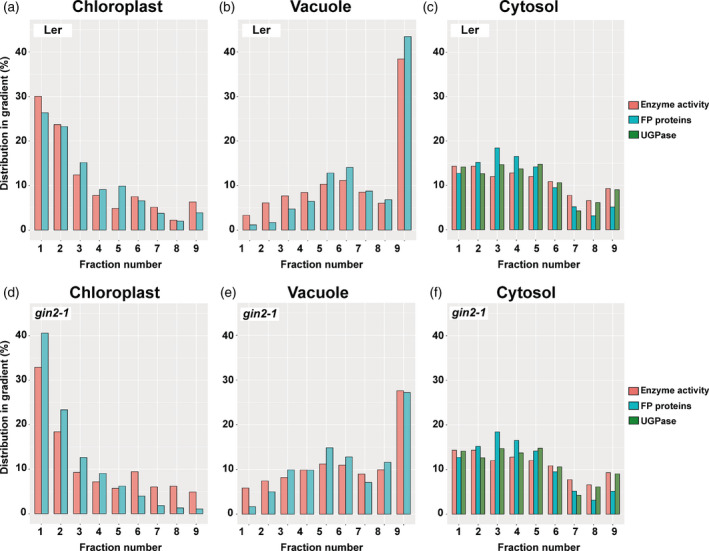
Comparison of different marker distributions in a typical gradient. (a–c) Ler and (d−f) gin2‐1 in three compartments (a, d: chloroplast; b, e: vacuole; c, f: Cytosol). Red colour indicates measured enzyme activities that were photometrically determined. Marker enzymes were pyrophosphatase (chloroplast), acid phosphates (vacuole) and UDP glucose pyrophosphorylase (UGPase; cytosol). Cyan bars represent mean values of all subcellular marker proteins (LC‐MS/MS; Table S1). For cytosol, protein abundance is additionally provided for cytosolic UGPase (green bars) to allow the direct comparison to enzyme activity (red bars).