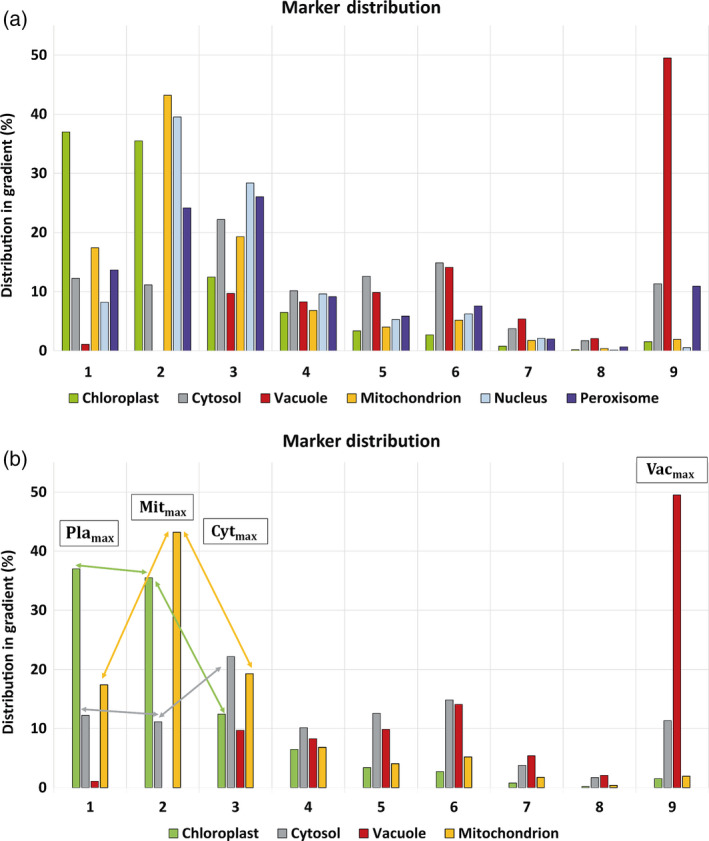
Figure 3.

LC‐MS/MS subcellular marker distribution for a typical gradient. (a) Mean marker distribution across a nonaqueous density gradient. Mean values were built for all marker proteins listed in Table S1. (b) Compartment marker dynamics applied for correlation with metabolites. Arrows exemplarily indicate dynamics of plastidial, mitochondrial and cytosolic marker proteins which were compared with dynamics of metabolites in the same gradient. Maxima (‘max’) of compartment markers are exemplarily depicted. Comparison of fractions 1 and 2 indicates positive slopes for mitochondrial markers, and slightly negative slopes for chloroplasts and cytosol (both less than 10% and therefore not considered for metabolite distributions). Comparison of fractions 2 and 3 revealed negative slopes for chloroplasts and mitochondria and a positive slope for cytosol. Chloroplast (Pla, green), cytosol (Cyt, grey), vacuole (Vac, red), mitochondria (Mit, yellow), nucleus (pale blue), peroxisome (purple).
