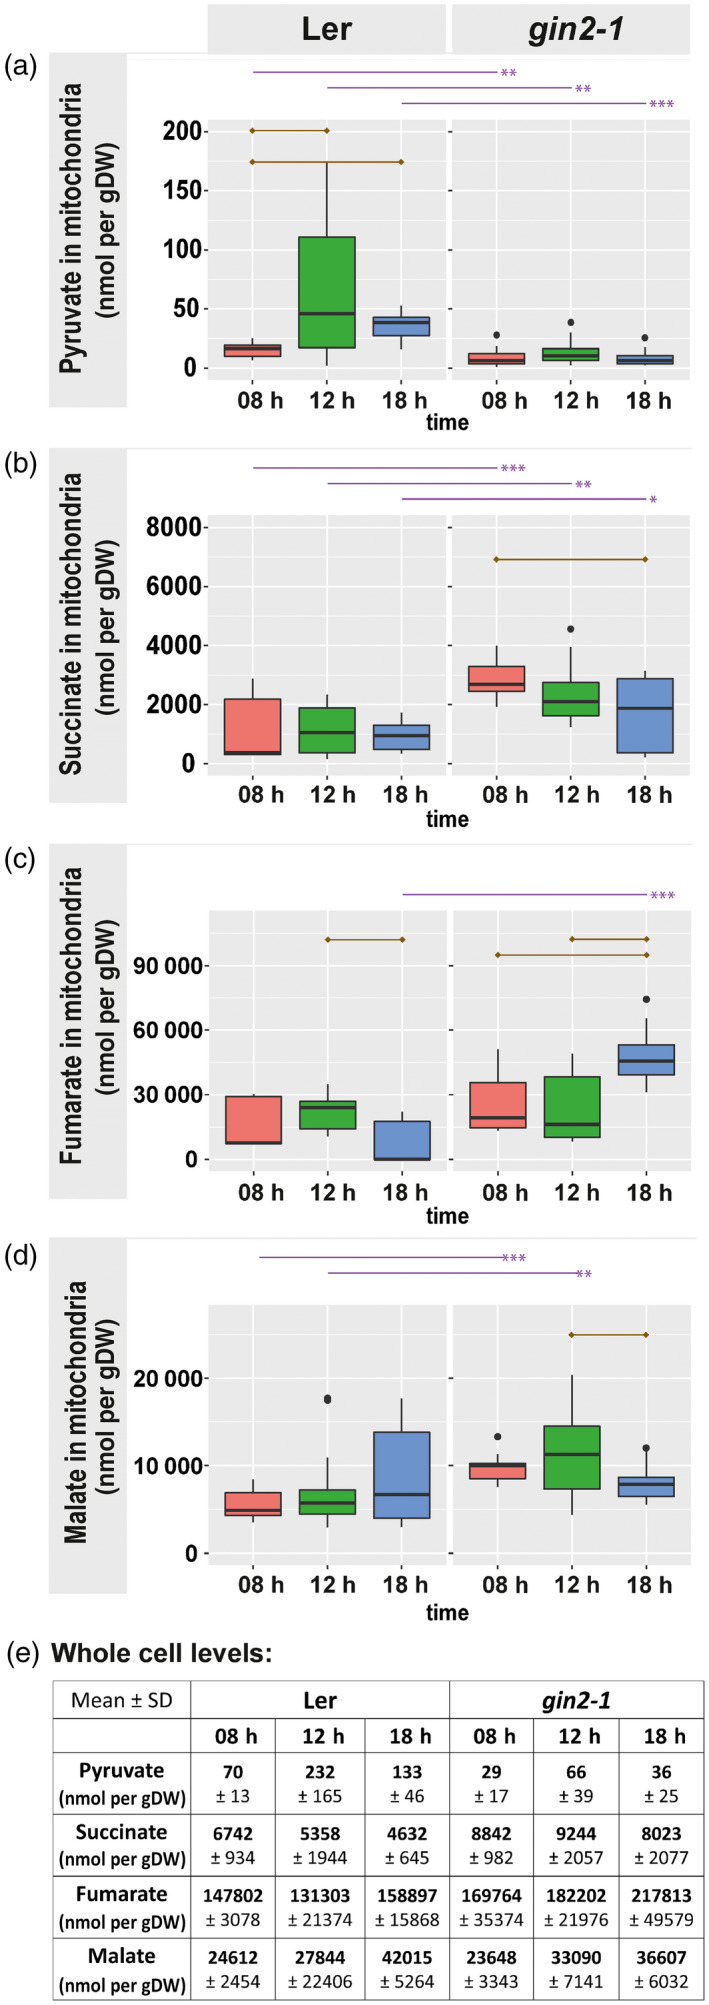
Figure 6.

Pyruvate and TCA cycle intermediates in mitochondria. (a) Pyruvate, (b) succinate, (c) fumarate and (d) malate in [nmol/gDW] for both genotypes. (e) The table contains absolute amounts of pyruvate, succinate, fumarate and malate at a whole cell level (mean ± SD, n = 5). Dry weight refers to the total weight of the sample. Purple lines above graphs indicate significant differences between genotypes at the same time point (n = 3 × 5; t‐test, *P < 0.05, **P < 0.01, ***P < 0.001). Brown lines inside of graphs indicate significant differences within genotypes (t‐test, P < 0.05, Bonferroni correction of multiple comparisons).
