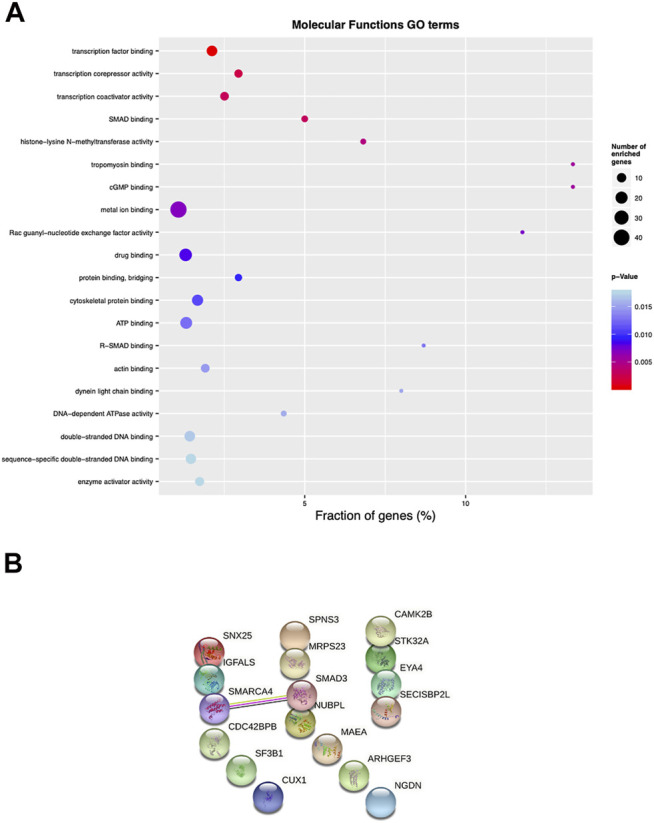
FIGURE 7.

Pathway enrichment and protein-protein interaction analysis of psoriatic disease MZ twins. (A) Top 25 differentially enriched GO terms identified by the “topGO” Bioconductor tool, using the “molecular functions” database, ordered by elimFisher p value. The width of the dots indicates the percentage of the enriched genes out of the total number of genes belonging to each term. (B) protein-protein interaction analysis evaluated with stringdb (https://string-db.org).
