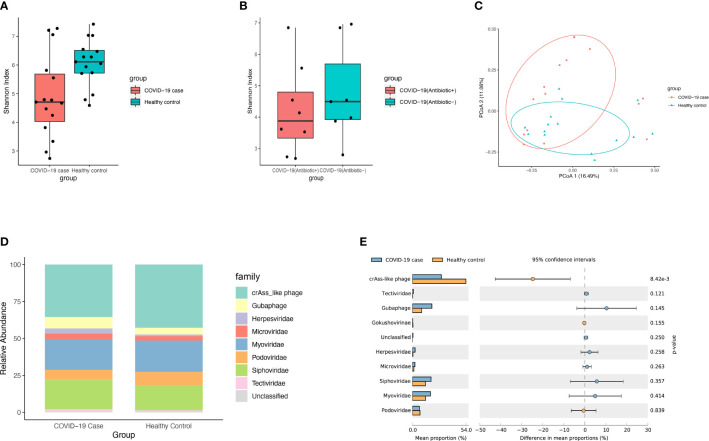
Figure 1.
Viral diversity and composition of microbial community. (A) Boxplot showed viral alpha diversity between COVID-19 patients and healthy controls based on the Shannon index. The dot points represent the index of each of samples. (B) Boxplot showed viral alpha diversity between COVID-19 patients with antibiotic treatment(Antibiotic+) and those without antibiotic treatment(Antibiotic-) based on the Shannon. (C) PCoA analysis based on Bray-Curtis distance between COVID-19 patients and healthy controls in the relative abundance of virome. The dot points represent the distance of each of samples from the two most explainable dimensions. (D) Viral community structural composition and distribution on family level. The Stack bar diagram represent the percent of taxonomical composition in two groups. (E) The extended error barplot shows the abundances of different viral abundances in the two groups of samples. The middle shows the abundances of different species within the 95% confidence intervals. The value on the far right is p-value.

