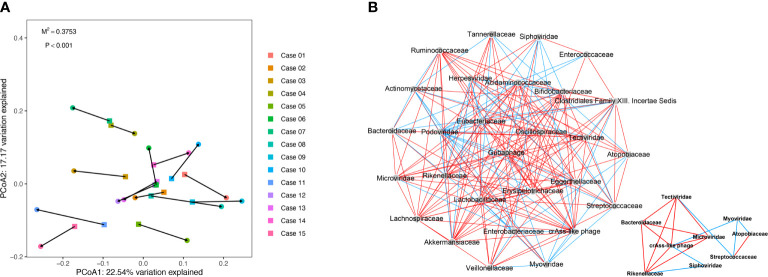
Figure 2.
Procrustes analysis and Co-occurrence network analysis between virome and bacteriome in COVID-19. (A) Procrustes analysis of the correlation between viral and bacterial communities of COVID-19 patients. (B) Co-occurrence network analysis between virome and bacteriome. Each nodes represents virus and bacteria on family levels. Edges represented positive associations (red) and negative associations (green) between virus and bacteria. The cutoff of the Spearman correlation and p-value were set at 0.3 and 0.05, respectively.

